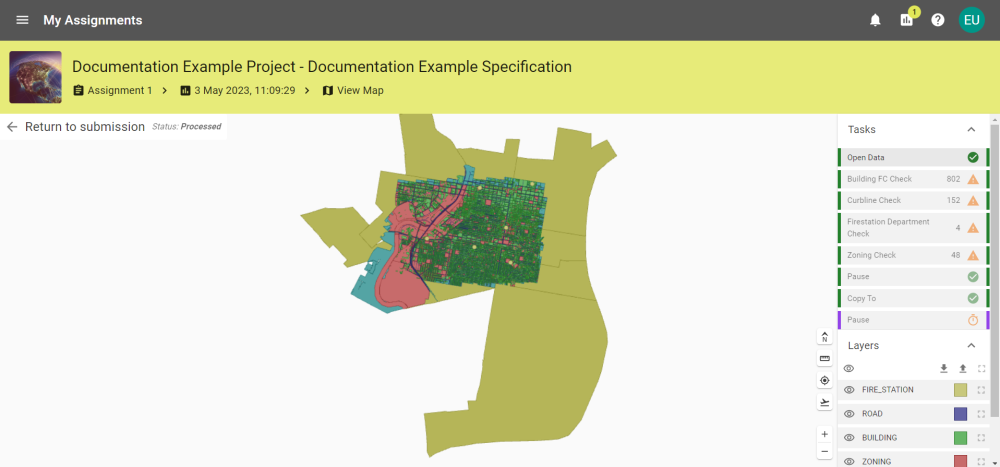
View Map
Spatial Data can be viewed on a Map during the Process Submission stage.
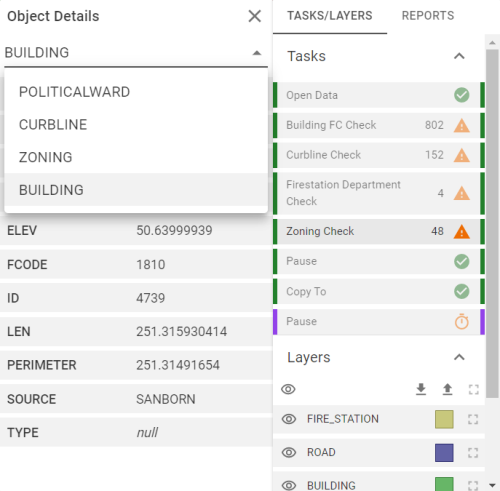
Selecting an object on the map will open the Object Details panel, detailing the object's information. If there are overlapping geometries, the Selected Object drop down will give a selection of objects that occupy the same space.
To exit the Map Viewer, click the back button in the browser or click 1Spatial on the breadcrumbs.
 Map Icons
|
Icon |
Description |
|---|---|
|
|
Resets the map view to its default view. |
|
|
Used to measure distance between two or more points on the map. Clicking on the map creates a point. A line is drawn, showing the distance to the mouse. Click again to make additional points, recording the distance between those points. Double-click on the final point or press Esc to stop creating new measurements. Note: The units of measurement used in the measuring tool are always metres, regardless of the source data.. |
|
|
Click a point on the map and it will copy the co-ordinates to your clipboard. |
|
|
Enter X and Y co-ordinates and click Fly to centre the map view on the location entered. |
|
|
Zoom the Map in. |
|
|
Zoom the Map out. |
|
|
Download the layer styles (JSON). |
|
|
Upload a layer style (JSON). |
|
|
Render the layer as a wireframe. |
|
|
Render the layer as filled. |
|
|
Hide the layer. |
|
|
Unhide the layer. |
Map Tabs
Tasks or Tasks/Layers if there is a Reports tab.
A list of the Tasks will show the progress of the Session. Selecting a task from this tab will update the state of the map to that of the task.
Tasks that generate reports will enable the Reports tab.
Layers
The Layers tab allows you to toggle settings for layers on the map individually or as a group.
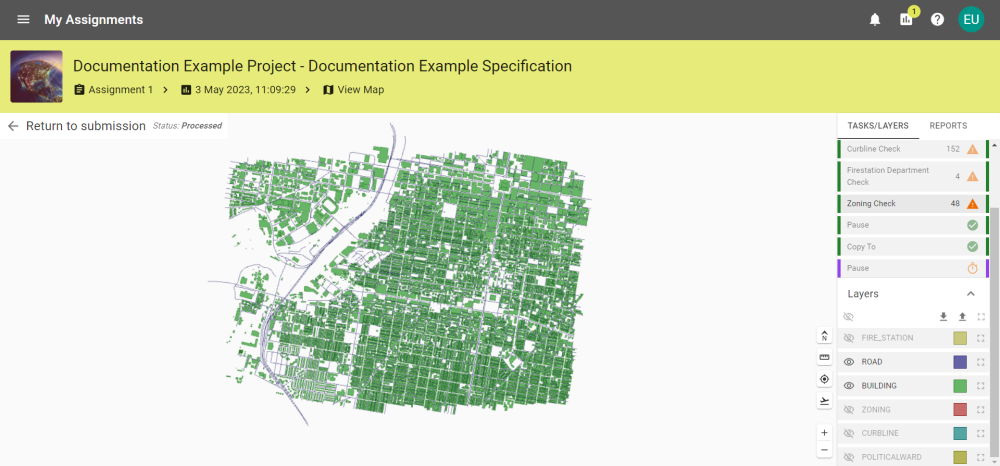
The layers can be hidden/unhidden, rendered as a wireframe or filled (default), colours can be edited by clicking the colour on a layer, and the layer settings can be downloaded or uploaded as a JSON file.
Reports
The Reports tab allows you to view the object report for a task if a report is generated.
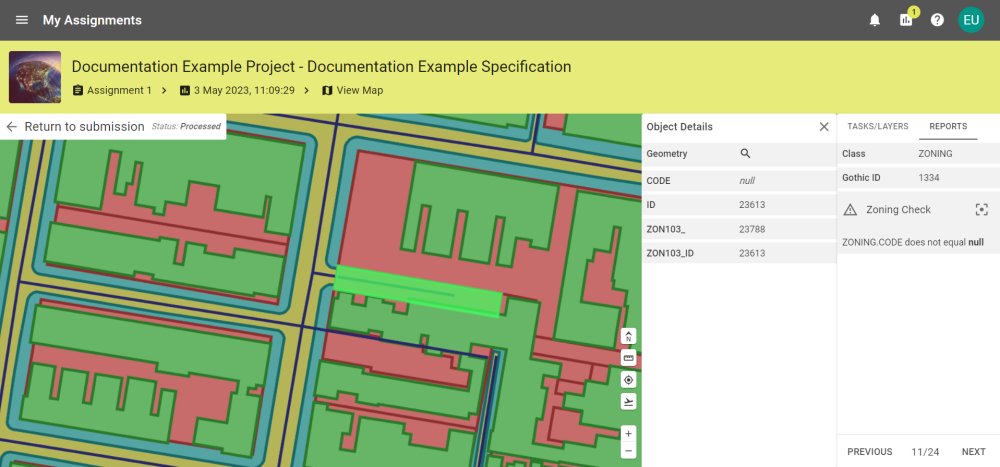
Clicking Previous or Next will step through report items, centering the map on the object and opening the Object Details panel for that object.


