View Map
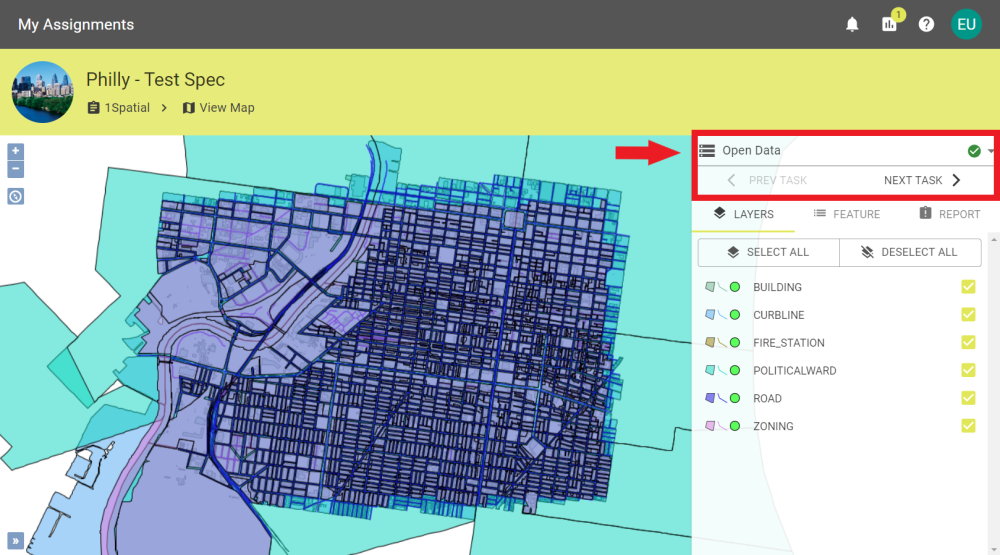
Spatial Data can be viewed on a Map during the Process Submission stage.
- Tasks can be stepped through by clicking Prev Task, Next Task, or the drop down menu above to see how the spatial data is represented during each task.
-
The Map viewer has three tabs:
-
Layers
The Layers tab allows you to toggle the layers on the map individually or select/deselect all layers.
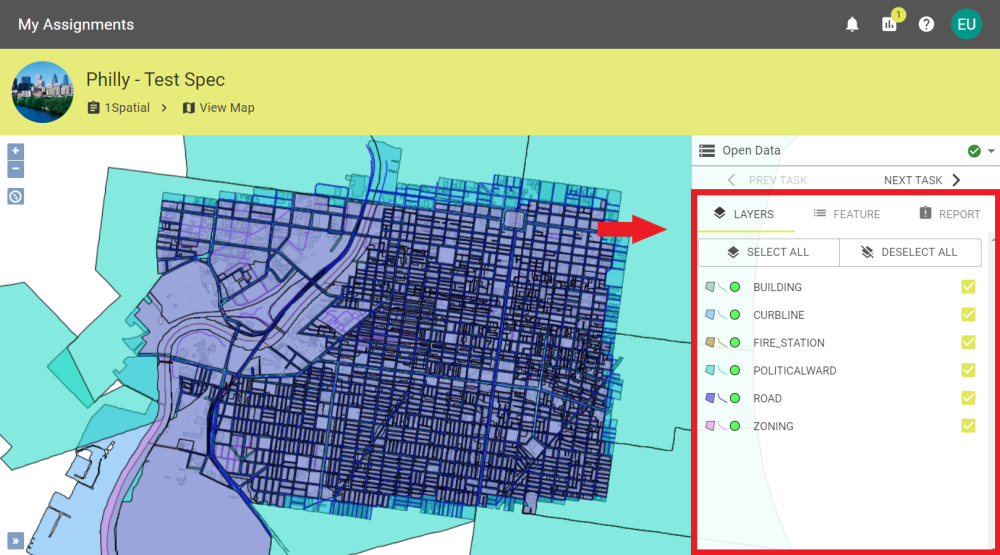
The Map Viewer layers pane -
Feature
The Features tab allows you to select a specific feature from an area you selected on the map and see the feature's details. This helps select specific features when there are overlapping geometries.
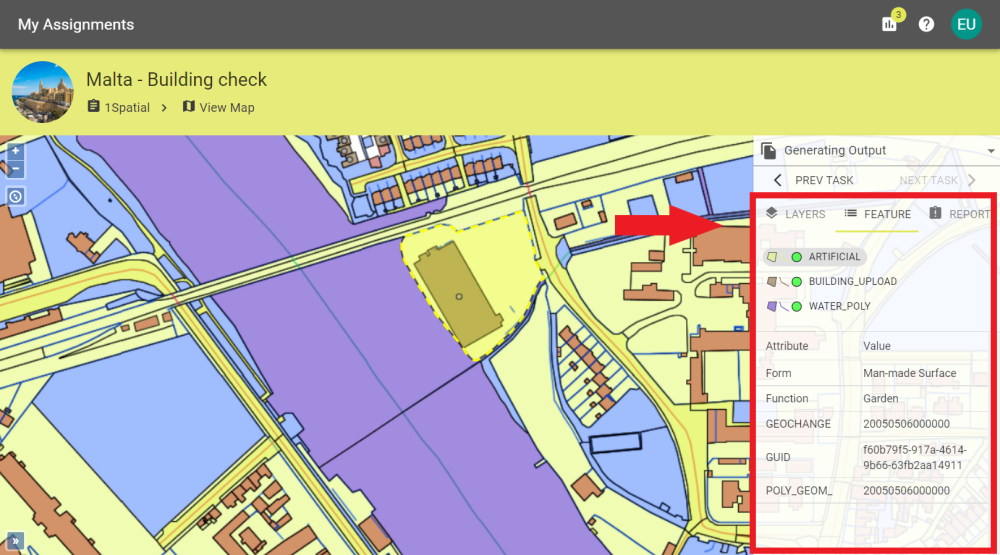
The Map Viewer feature pane -
Report
The Reports tab allows you to view the object report for a task if a report is generated.
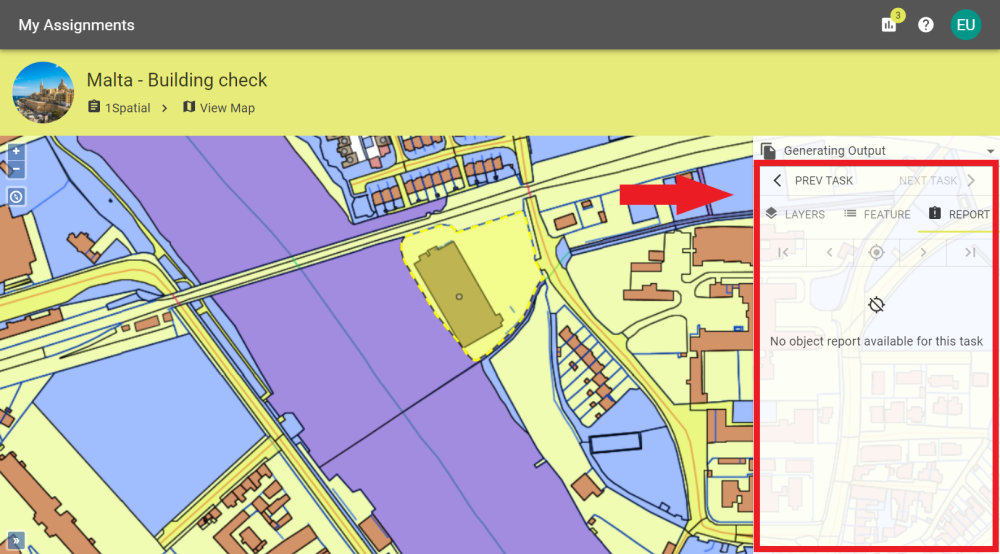
The Map Viewer report pane
-
-
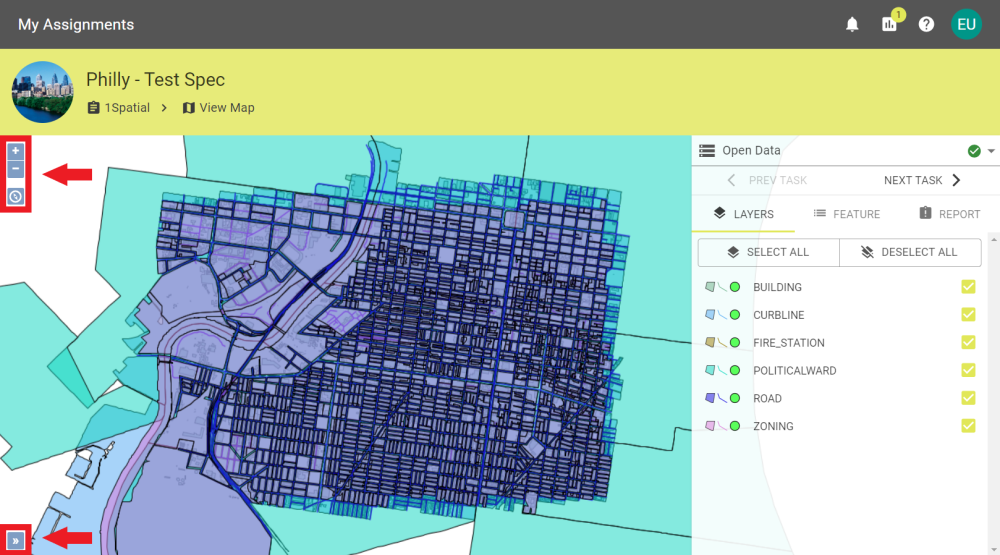
To Navigate the Map you can use:
- Left click to select a Feature.
- Left click and drag to move around the map.
- Scroll the mousewheel or pinch your fingers together/apart on a touchpad to zoom in/out.
- Clicking the
 icon or the
  icon will also zoom in or out.
 - Click the
 icon to recentre the map.
 - Click the
 icon to open an overview map that shows where on the map you are zoomed in.
-
To exit the Map Viewer, click the back button in the browser or click 1Spatial on the breadcrumbs.