1Integrate Session Data Viewer
The 1Integrate Session Data Viewer allows you to view spatial data related to a 1Integrate session.
Launch the viewer by clicking the View Map link in a session, or via a View link next to a non-conformance in the Rule Conformance Results HTML report (see Rule Conformance Results Report).
The Session Data Viewer opens in a new browser tab.
Note: The Session Data Viewer is disabled for a session that was run using Production Mode (see Production Mode).
Two panels are displayed within the Session Data Viewer: one displaying the Attributes of any selected features, the other displaying Session, Report and Legend data. Both of these panels can be re-sized by dragging the corners indicated with a triangle.
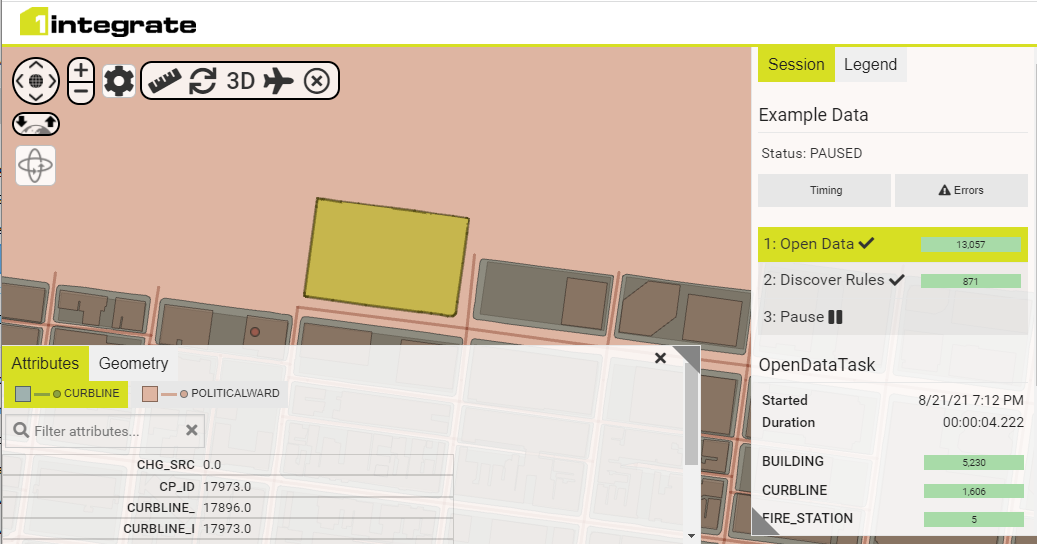
1Integrate Session Data Viewer
The Session tab displays a summary of the session that was run. Click Timing to see statistics for the session (see Session Timing Statistics), or click Errors to see details of any errors that occurred in the session (see Investigating Session Errors).
You can select a task within the Session tab to see how the data looks at the end of this task in the session. Selecting tasks incrementally allows you to see how the data evolves, and can be especially useful for debugging actions.
The Report tab displays all non-conformant objects that were highlighted in the report. For each object, the report panel displays the feature class of the object, its object ID, and the name and description of the rule(s) the object failed.
You can navigate between the non-conformant objects using the first, previous, next and last arrow buttons.
For each non-conformance, the related feature is highlighted and a "hotspot" marker pin-points the location of the non-conformance. There may be multiple hotspots per feature, in which case they are all shown. Clicking on a hotspot marker will make it slightly transparent, to allow you to see the details around the marker.
Note: Hotspot locations are only displayed when they can be automatically calculated from the rule logic.
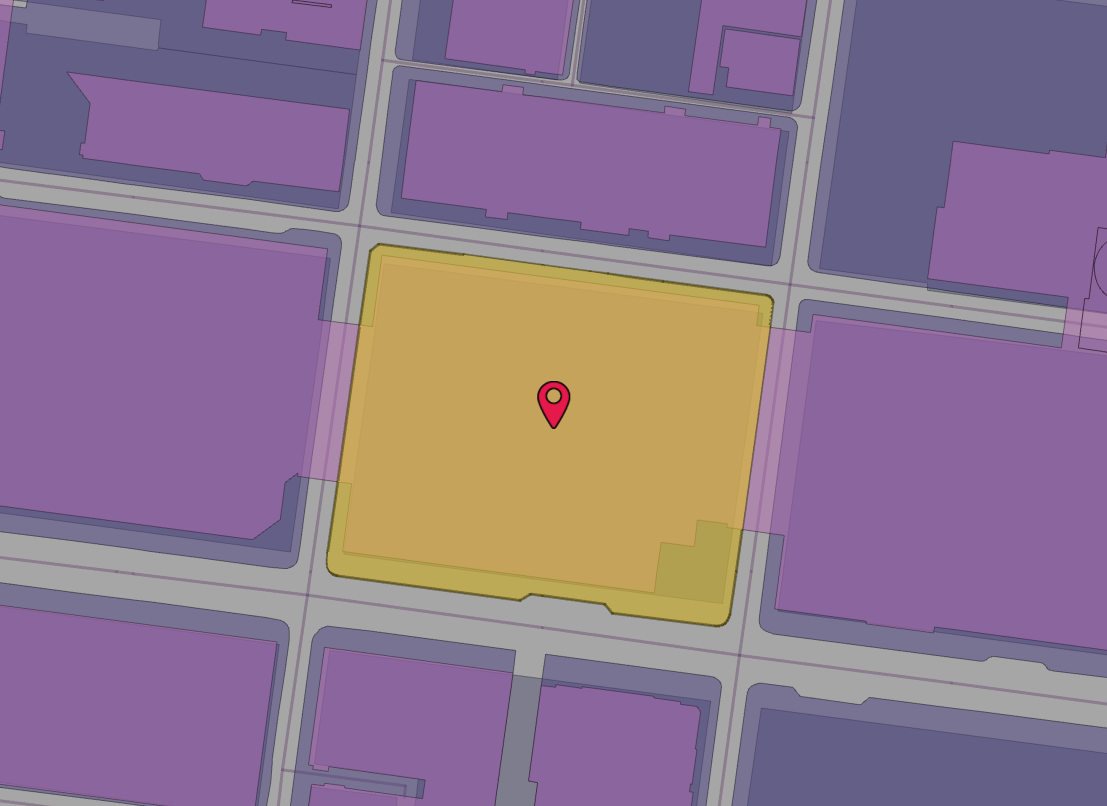
A hotspot marker indicating a non-conformance
Attributes and Geometry panel
The Attributes and geometry details for the currently selected feature are displayed in the Attributes panel.
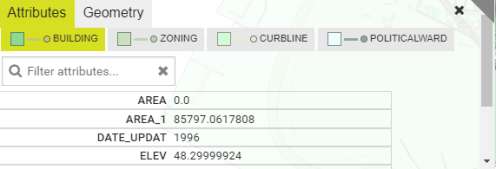
The attribute panel
When clicking on the map, the objects close to the click location are selected and shown in a list under the panel tabs. Select the object in the list to highlight it in the map view and show the attributes or geometry of that object in the panel.
The Attributes tab lists those attributes that are non-null for the selected object. The Geometry tab lists the calculated geometry metadata (such as number of parts, number of vertices, area, length) and also the Well-Known Text definition of the geometry with options for listing vertices as 5 decimal places, 15 decimal places or fractional form. The copy button copies the geometry into the clipboard.
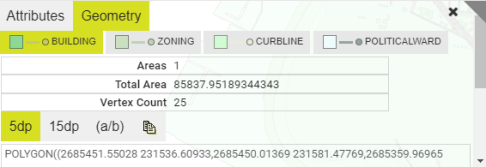
The Geometry panel
Legend Tab
The Legend tab lists all the layers that are available on the map, with each feature class occupying one layer. Each layer can be toggled on or off to determine if it is displayed or hidden, using the check box next to each layer, with the cube button used to toggle the layer between filled or wireframe mode (particularly useful for 3D solids).
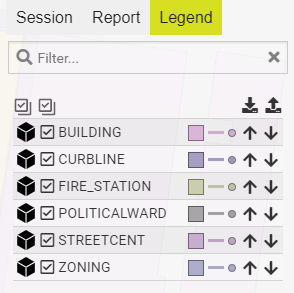
Session Data Viewer Legend
Clicking on the colour indicator next to a layer opens the Style Configuration page, which allows you to configure the colour and styling for each layer, determining how features are displayed in the Session Data Viewer.
You can save or load a preferred style by selecting the following icons to upload and download JSON files containing the styles you have configured:
-
Select
 to download a JSON file containing the styles currently in use.
 -
Select
 to upload a JSON file containing the layer styles.
Navigation
You can pan the map using the arrows on the pan tool in the top-left corner, or by left-clicking and dragging across the map.
Hold down Ctrl and drag to rotate the angle of view in 3D, or right-click on the map to centre the view at that location.
You can zoom using the zoom bar on the left of the screen, or by scrolling with the mouse wheel.
Navigation Icons
The navigation icons in the top left of the interface perform the following actions:
| Icon | Description |
|---|---|
|
|
To zoom in and out of the map, select the plus and minus icon. |
|
|
To move the camera select the arrows in the move icon. Select the centre circle to reset the viewpoint. |
|
|
Select the up and down arrows on the earth icon to change elevation. |
|
|
Select the rotation icon to rotate right to left (2D/3D) and up or down (3D only). |
Tools
Use the tools along the top of the viewer interface to perform the following actions
| Icon | Description |
|---|---|
|
|
To measure a distance in the Session Data Viewer, click the ruler icon to open the measuring tool. (located in the top-left corner, next to the pan tool), which can be used to measure a distance by clicking on the map to define the line to measure using two or more points, with the undo button to remove the last added point, or a double click on the final point to pause the measurement. Note: The units of measurement used in the measuring tool are the same as the dataset units (dependent on your source data). |
|
|
Select this icon to refresh the map. |
| 3D
2D |
When using the viewer, you can select to enable 2D or 3D modes:
Depending on the mode, the way you navigate around the map will differ. |

|
Selecting the aeroplane icon will display the current map centre coordinates for copying and allow you to input coordinates. The viewer will then centre on that coordinate. |
|
|
Only appears when a feature or tool (such as the measuring tool) is selected. Click the icon to de-select the feature or cancel the use of the tool. |
Selecting the aeroplane icon will allow you to input coordinates. The viewer will then centre on that coordinate.
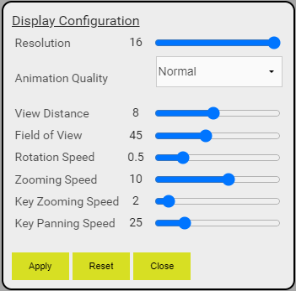
Configuration
Selecting the ![]() will give you a number of configuration options for the viewer which are used to maintain performance, particularly in 3D mode, by controlling aspects such as distance, resolution or field of view. Modify these if your machine is struggling to render the 3D view quickly enough. Click Reset to return to default values.
will give you a number of configuration options for the viewer which are used to maintain performance, particularly in 3D mode, by controlling aspects such as distance, resolution or field of view. Modify these if your machine is struggling to render the 3D view quickly enough. Click Reset to return to default values.