Process Submission
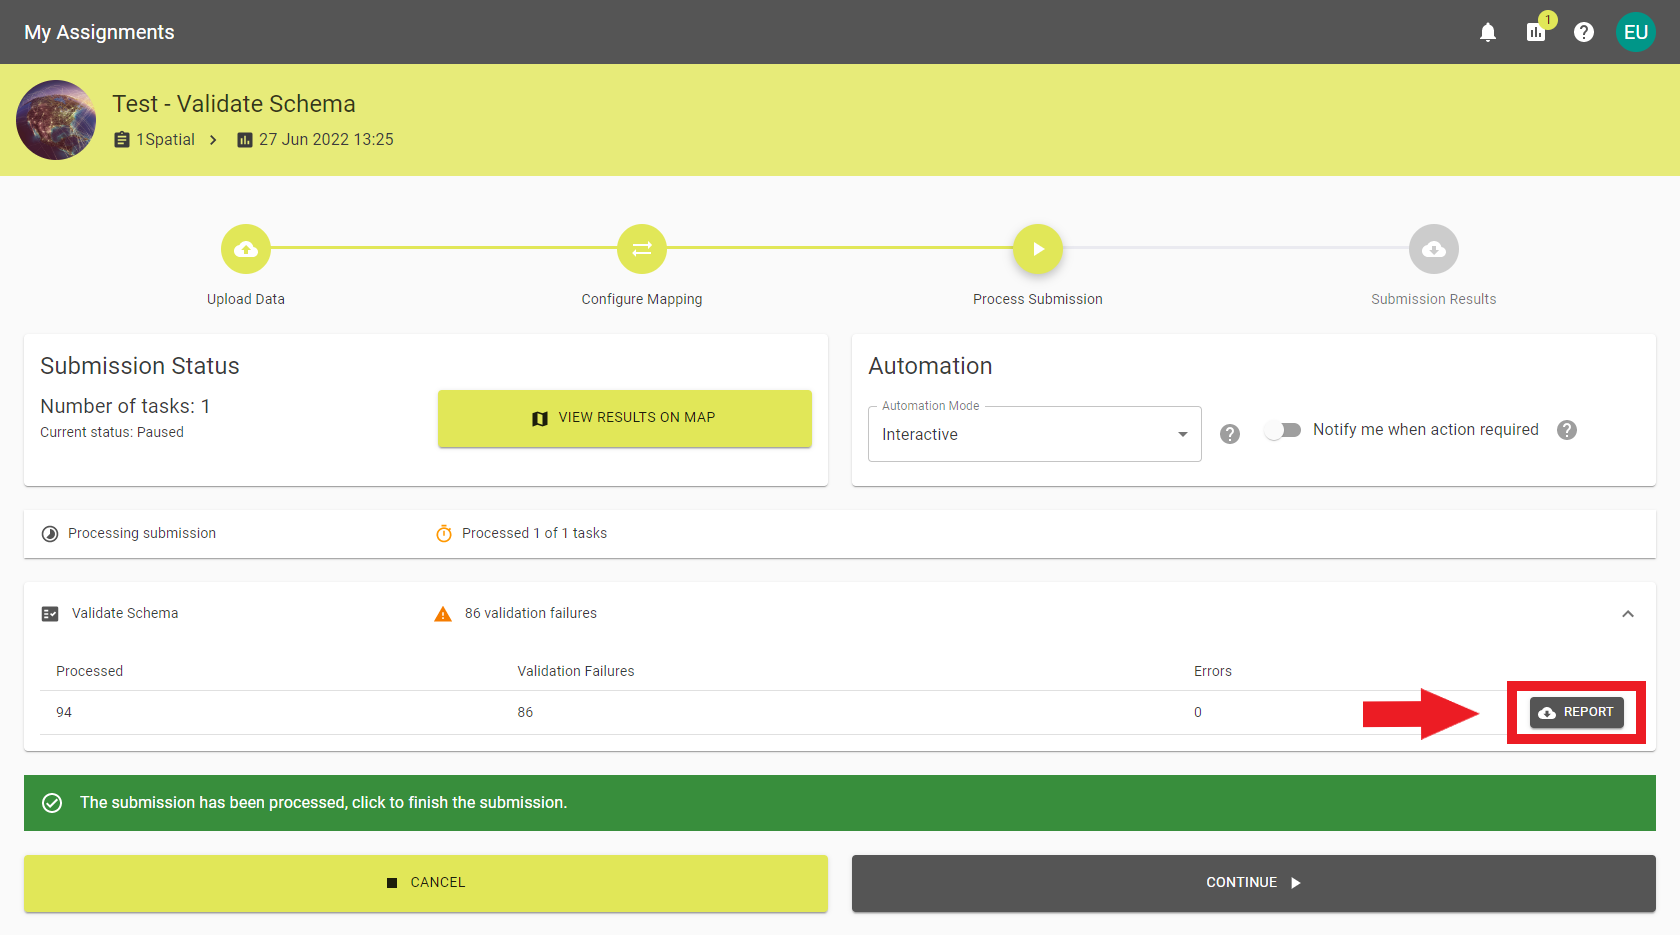
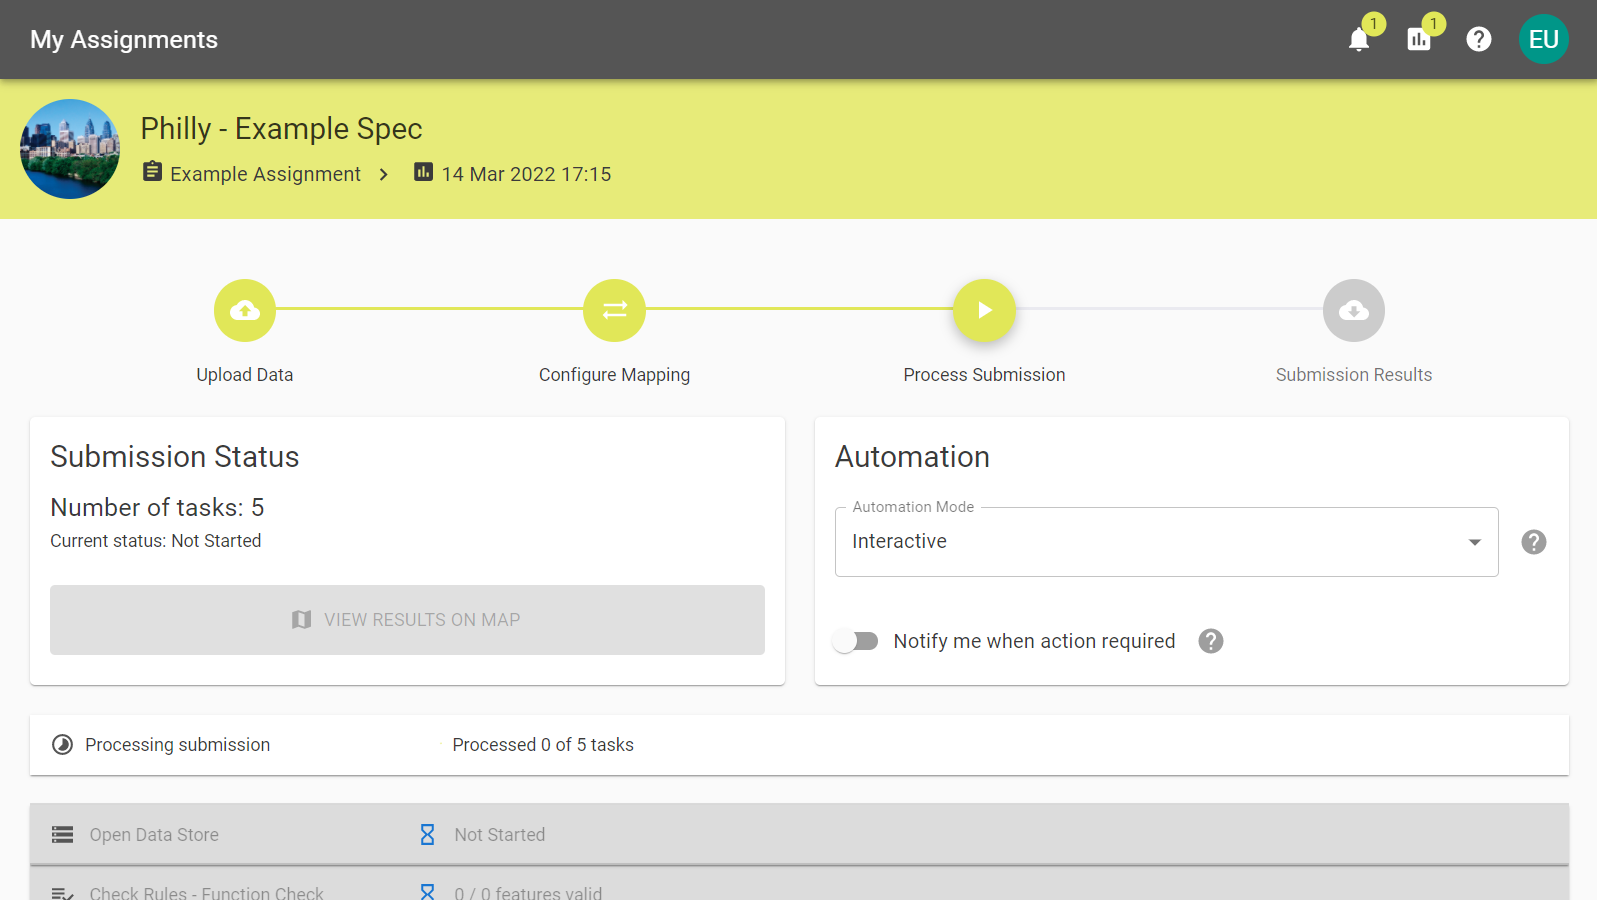
- At this point you don't need to do anything until it's run to completion. However, you may select an Automation
 Submissions with automation set up will run to the requested stage without further interaction. method to allow the submission to complete on its own or to notify you after it has reached a set stage.
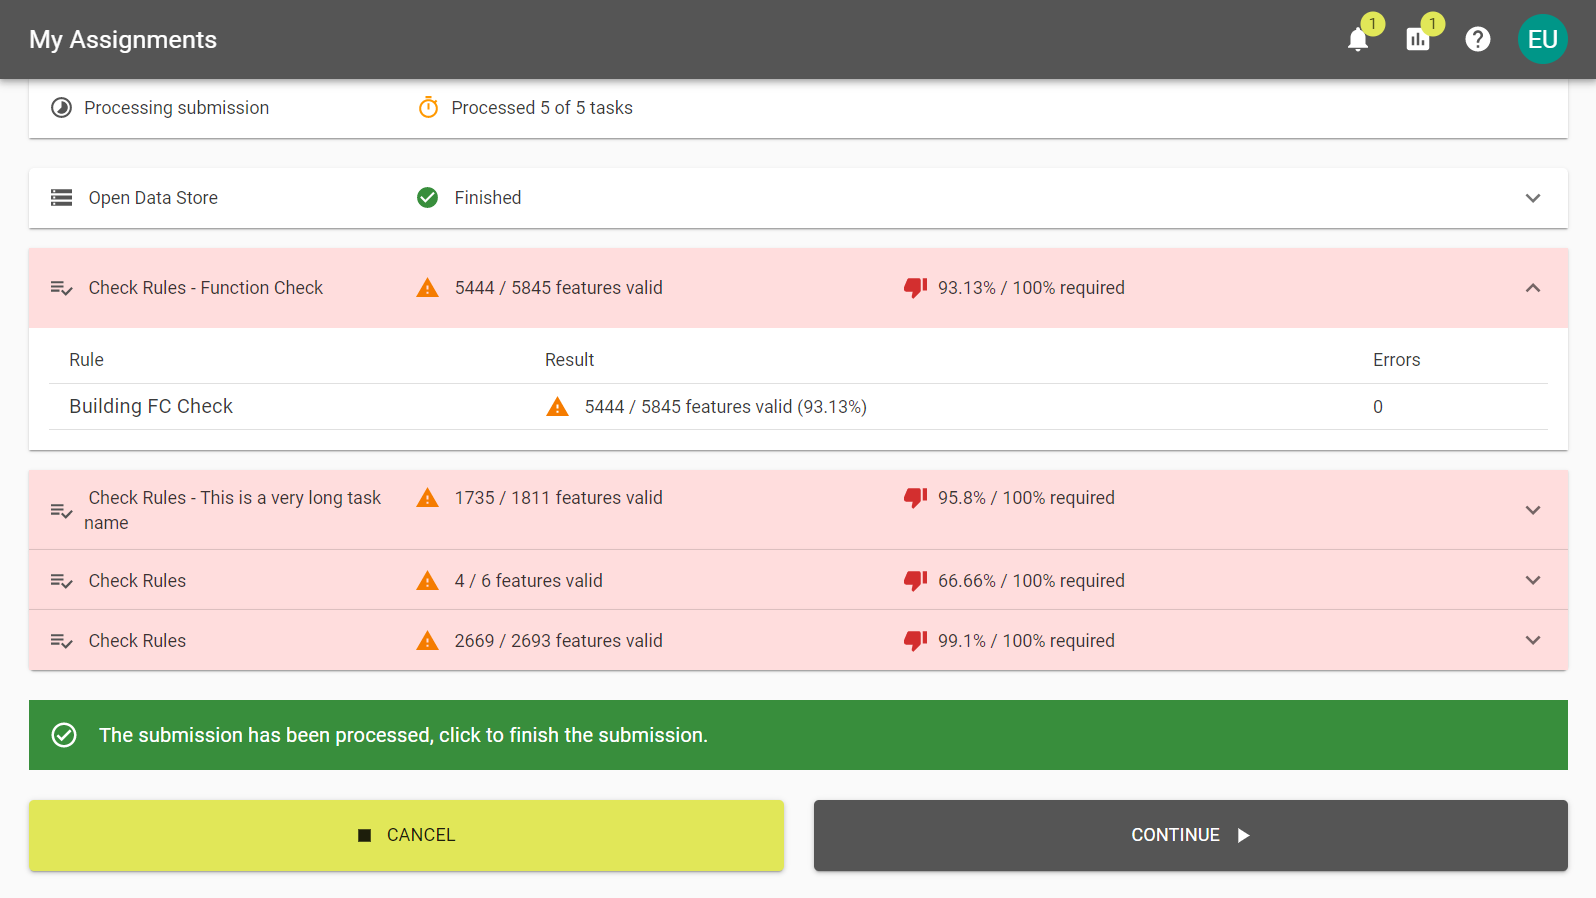
 - You can select tasks to expand and see a more detailed summary of completed actions. You can do this with task that have been completed even if it's still running.
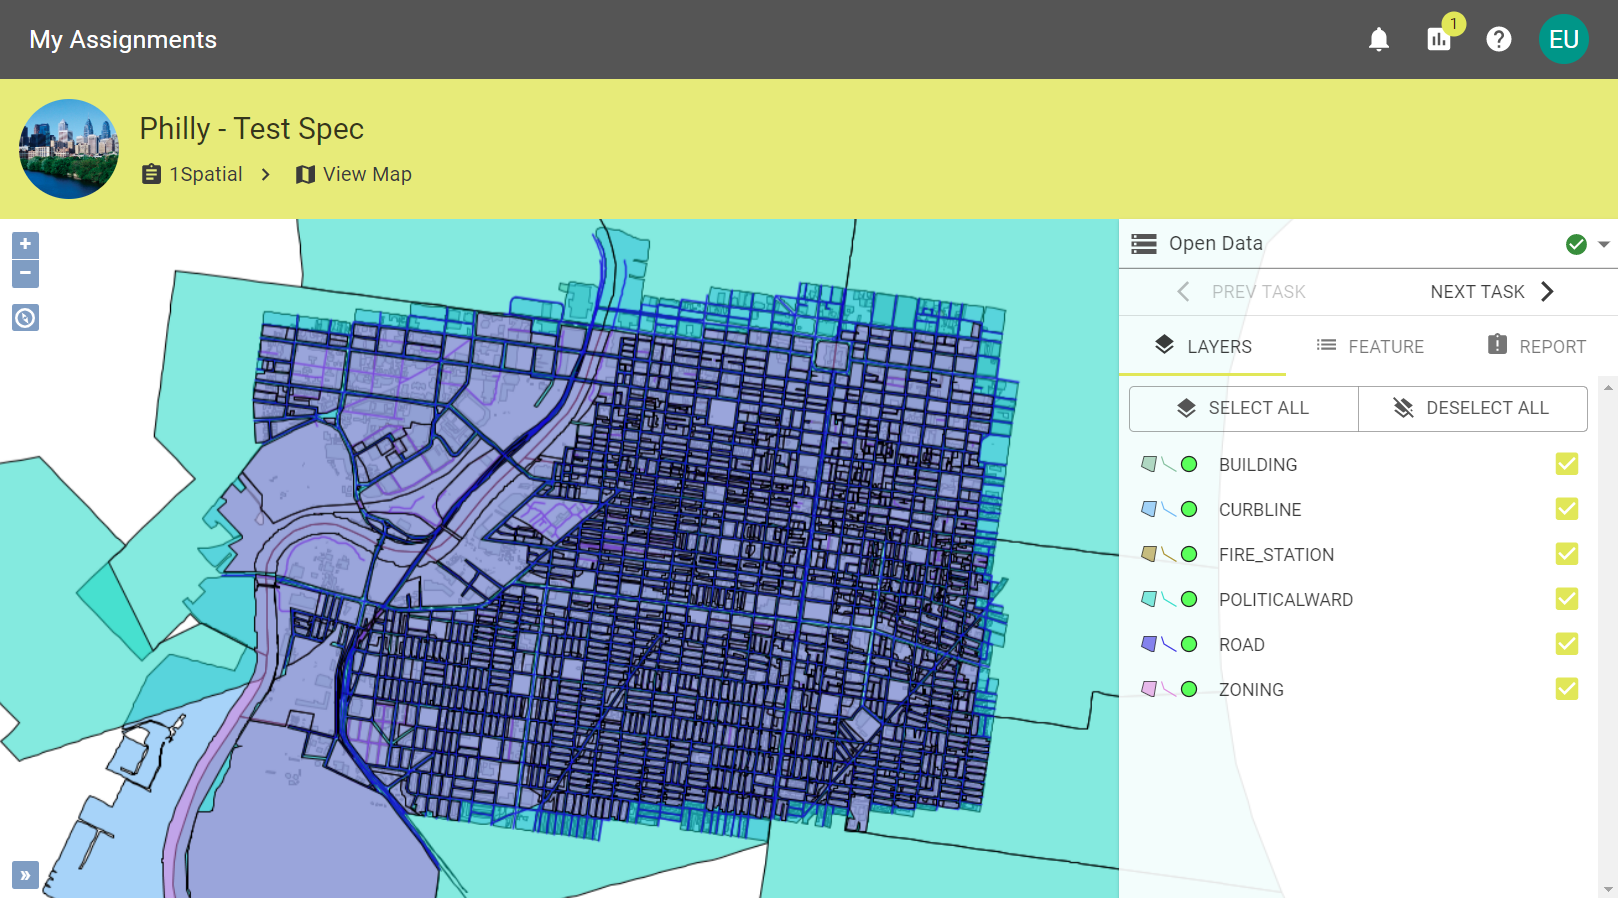
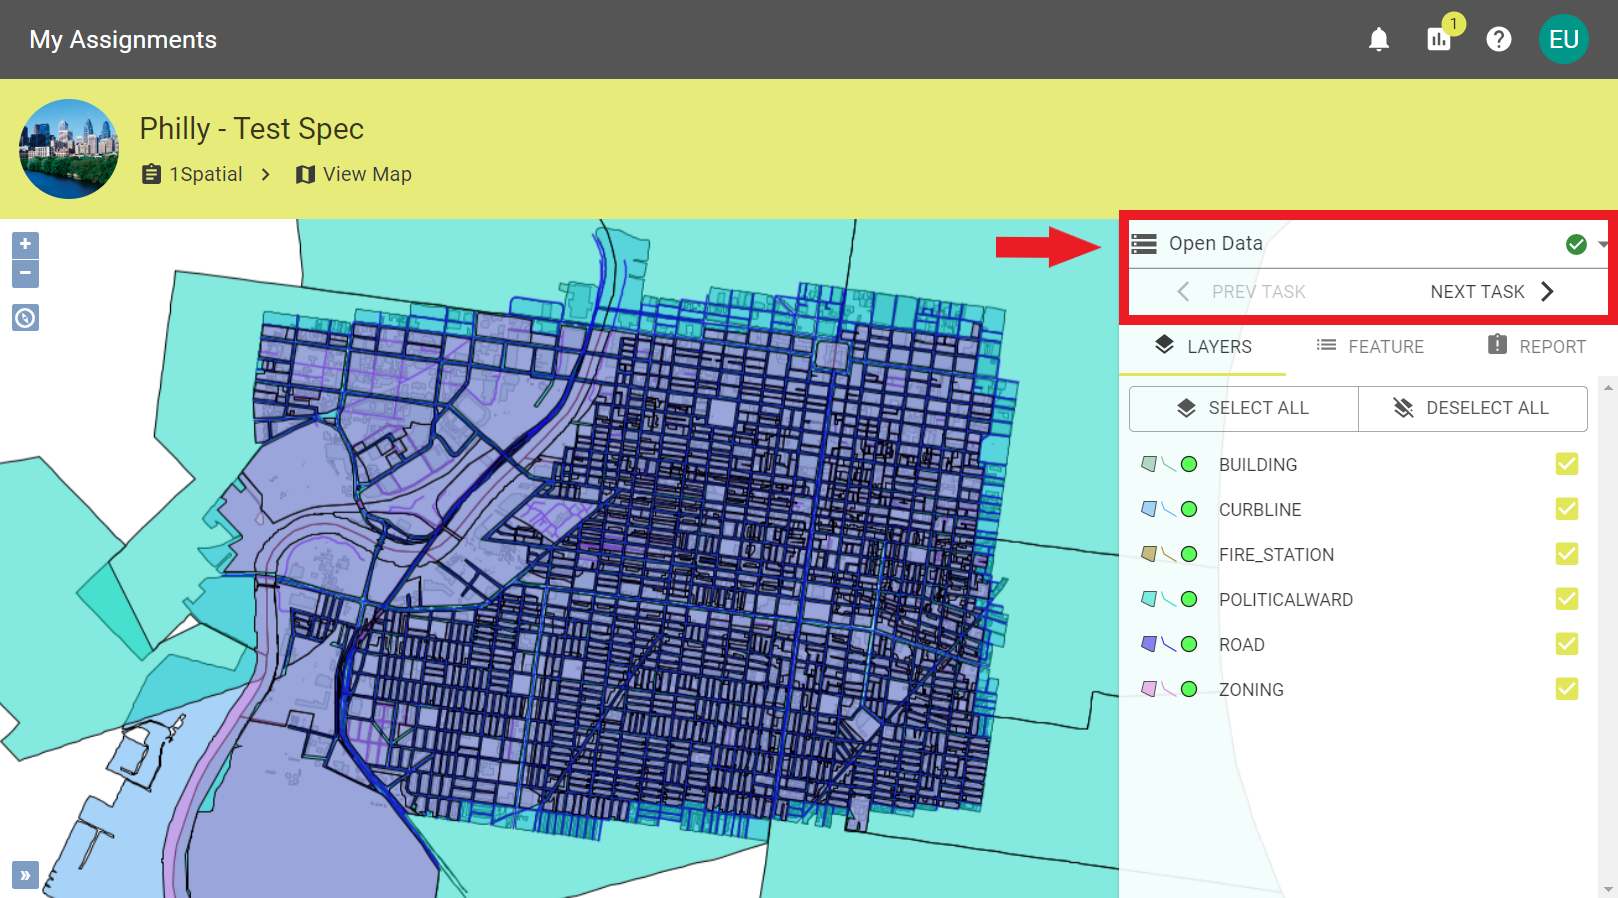
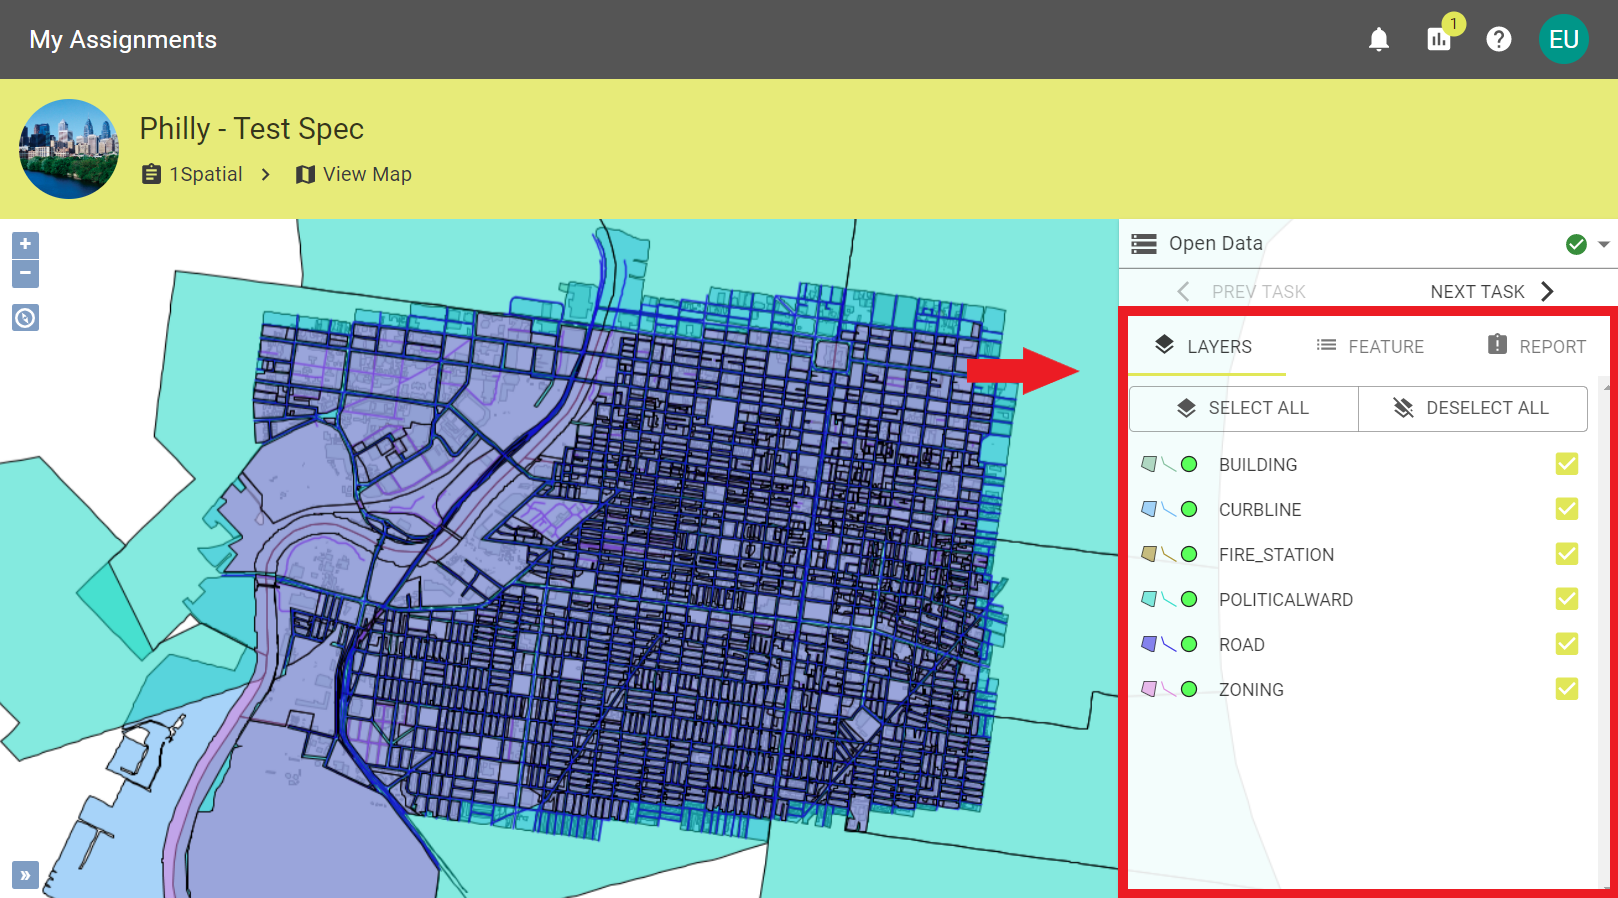
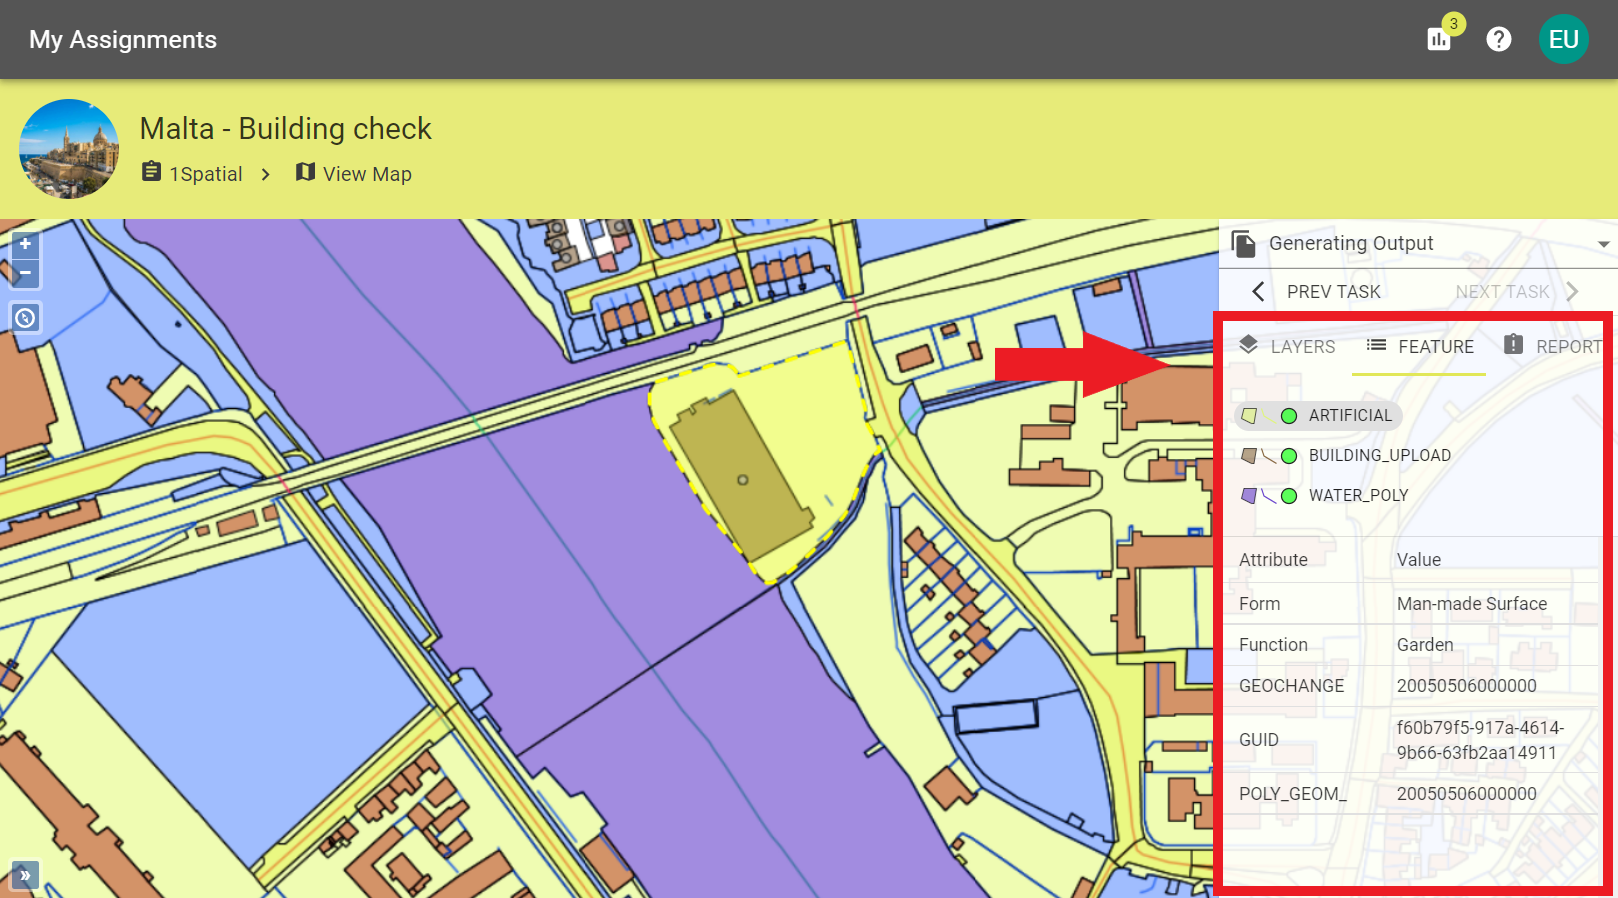
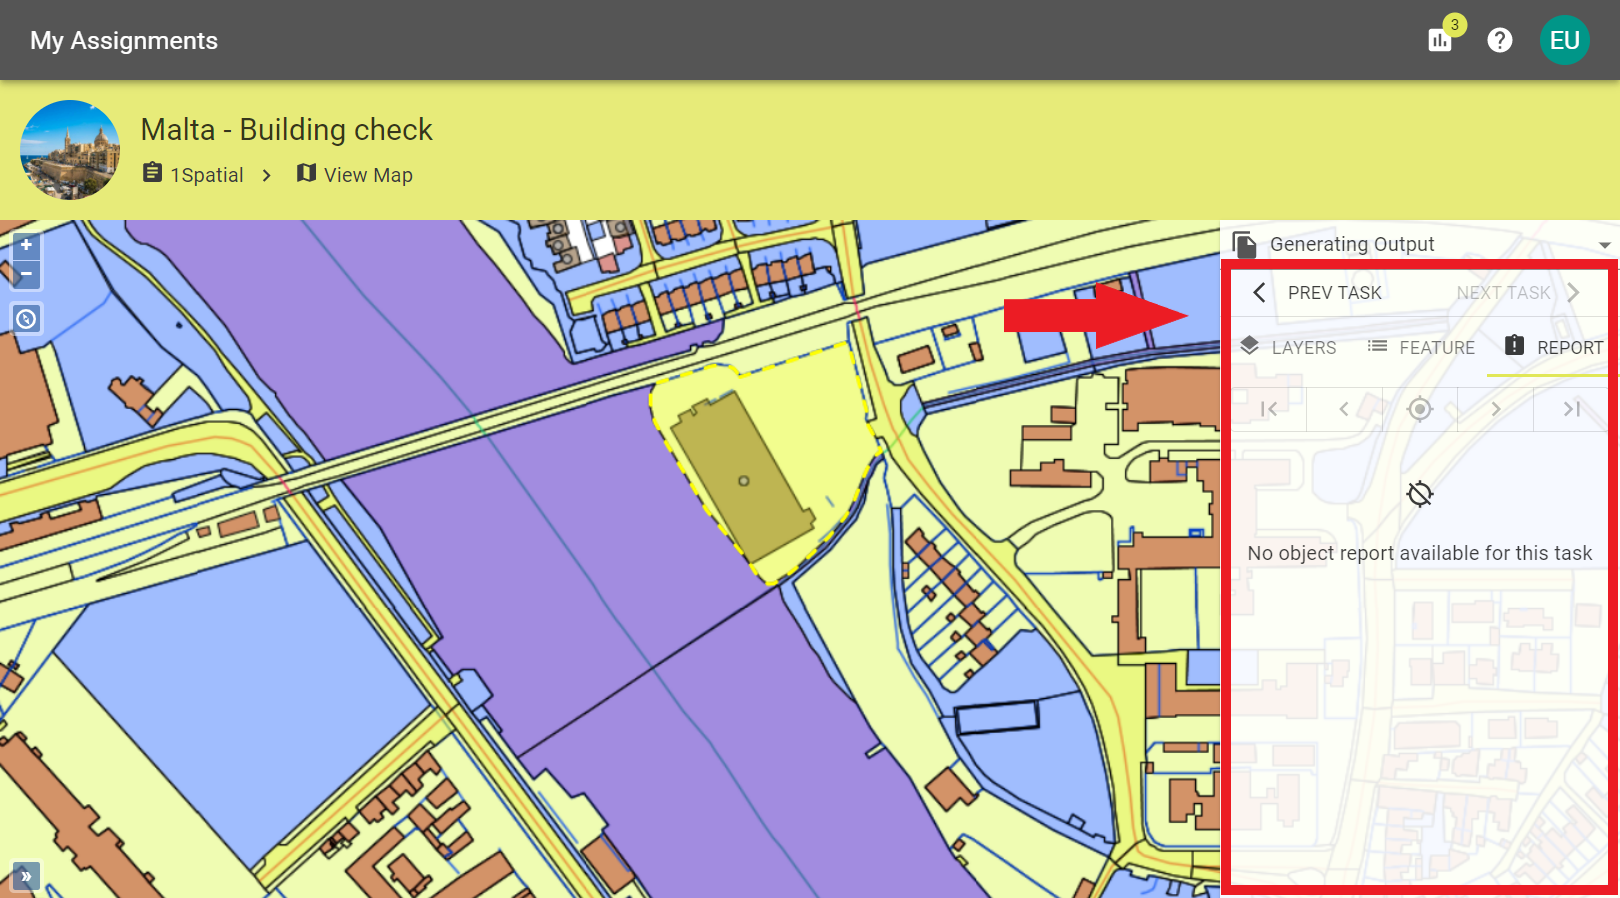
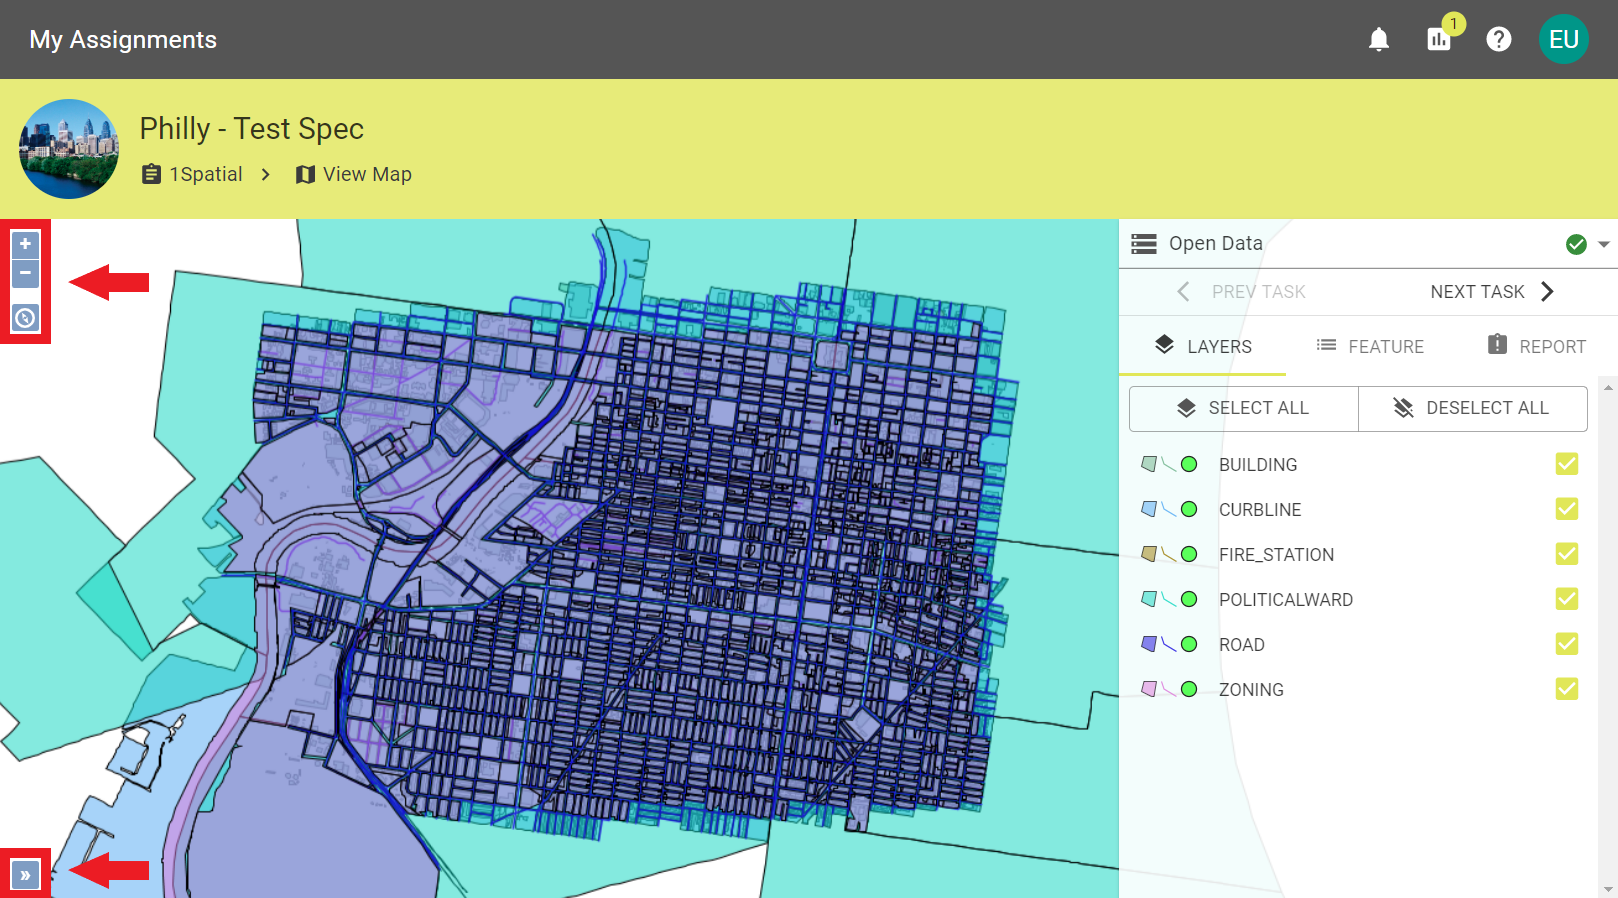
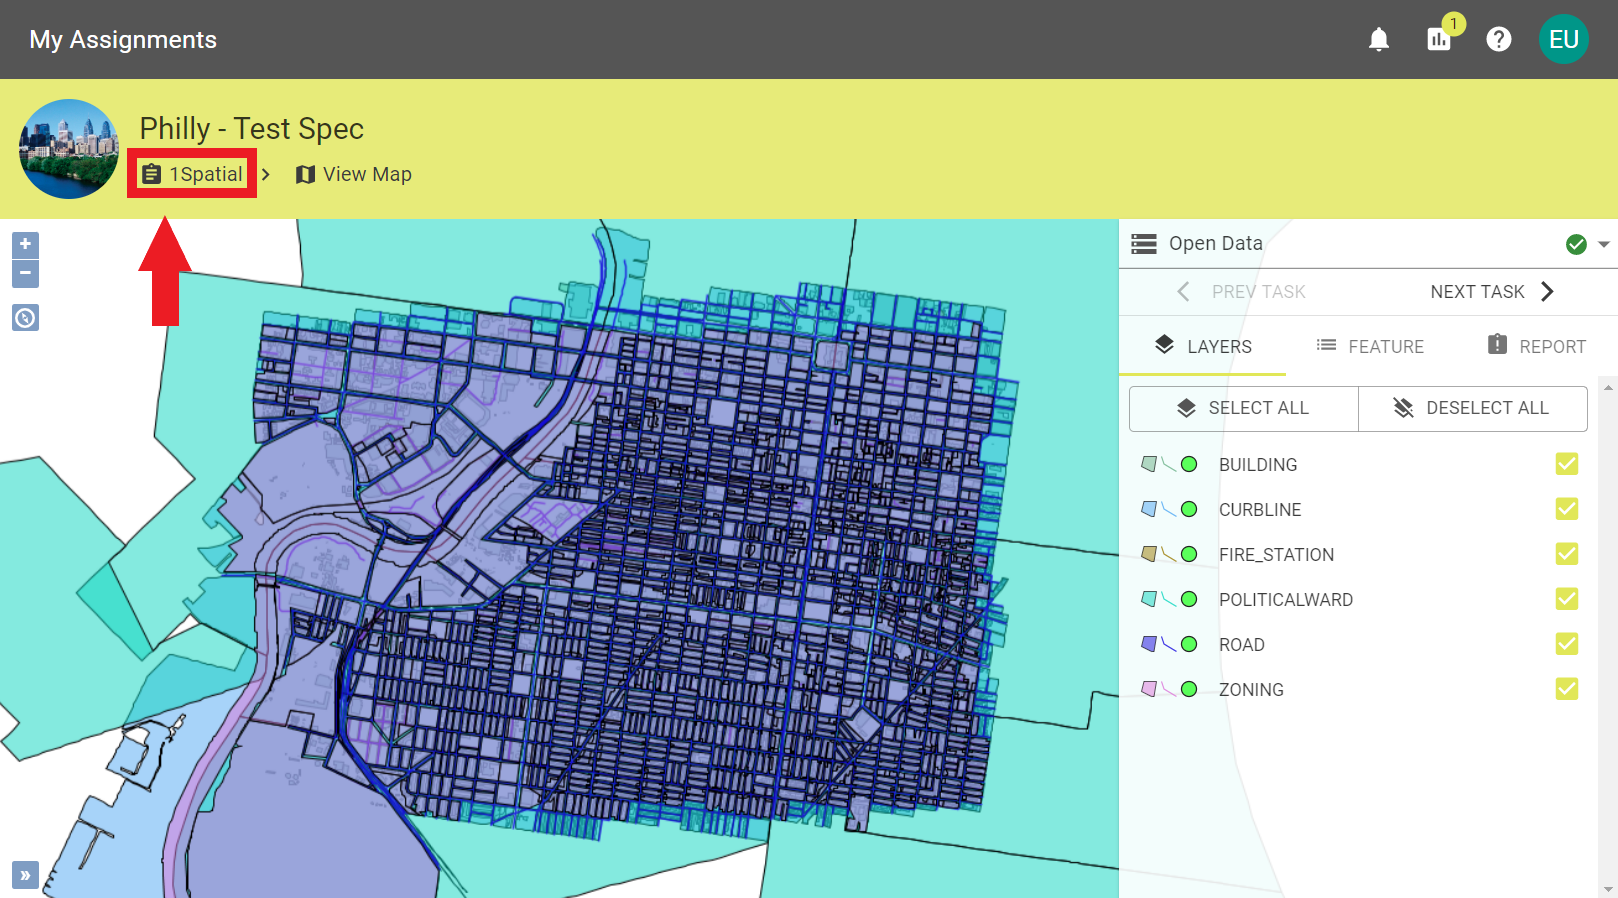
- For spatial data, you can view the results on a map.
- Select Continue to complete the submission.
The submission will work through the tasks and update as it completes them. For smaller Data Sets there may be little to no noticeable time between the first task starting and all tasks running to completion.

 View Results On Map

