1Integrate Cache Viewer
The 1Integrate Cache Viewer allows you to view non-conformant objects associated with rules run in a session.
Launch the viewer by clicking the View Map link in a session, or via a View link next to a non-conformance in the Rule Conformance Results HTML report (see Rule Conformance Results Report).
The cache viewer opens in a new browser window.
Note: The Cache Viewer is disabled for a session that was run using Production Mode (see Production Mode).
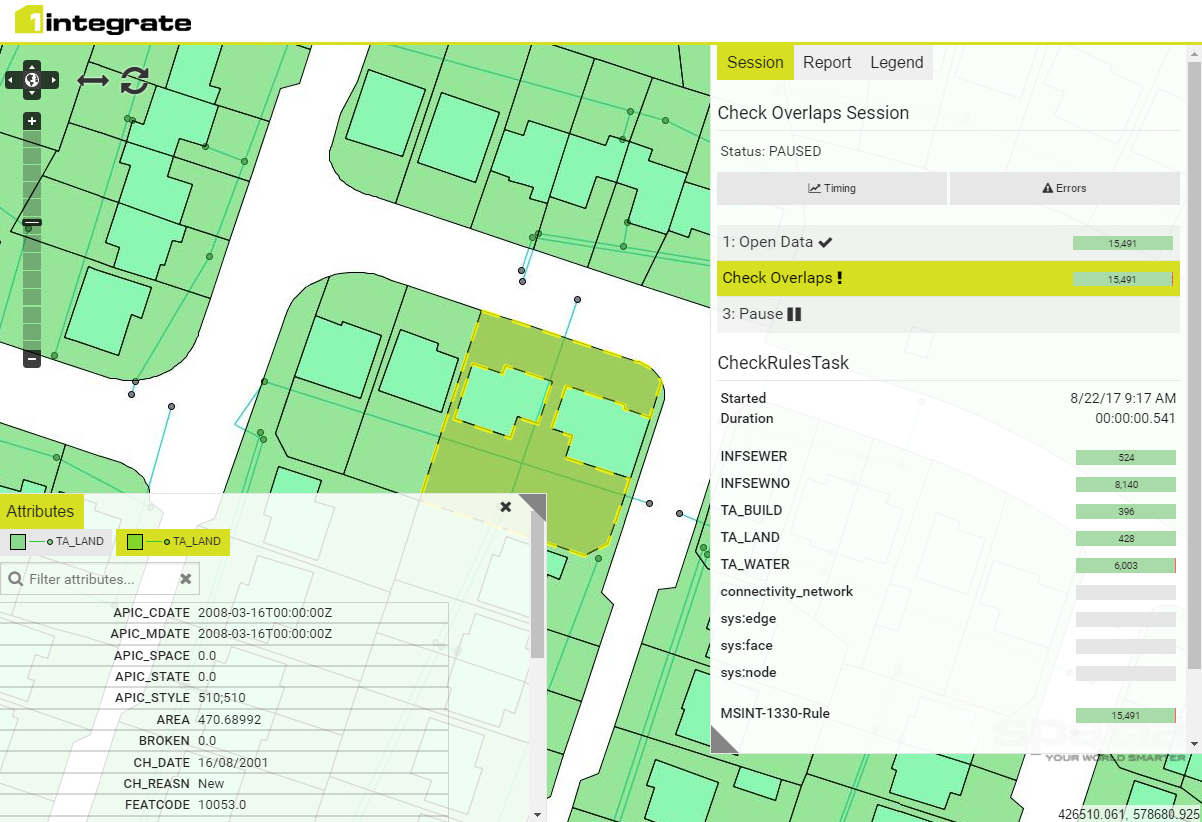
Two panels are displayed within the cache viewer: one displaying the Attributes of any selected features, the other displaying Session, Report and Legend data. Both of these panels can be re-sized by dragging the corners indicated with a triangle.
1Integrate Cache Viewer
The Session tab displays a summary of the session that was run. Click Timing to see statistics for the session (see Session Timing Statistics), or click Errors to see details of any errors that occurred in the session (see Investigating Session Errors).
You can select a task within the Session tab to see how the data looks at the end of this task in the session. Selecting tasks incrementally allows you to see how the data evolves, and can be especially useful for debugging actions.
The Report tab displays all non-conformant objects that were highlighted in the report. For each object, the report panel displays the feature class of the object, its object ID, and the name and description of the rule(s) the object failed.
You can navigate between the non-conformant objects using the first, previous, next and last arrow buttons.
For each non-conformance, the related feature is highlighted and a "hotspot" marker pin-points the location of the non-conformance. There may be multiple hotspots per feature, in which case they are all shown. Clicking on a hotspot marker will make it slightly transparent, to allow you to see the details around the marker.
Note: Hotspot locations are only displayed when they can be automatically calculated from the rule logic.
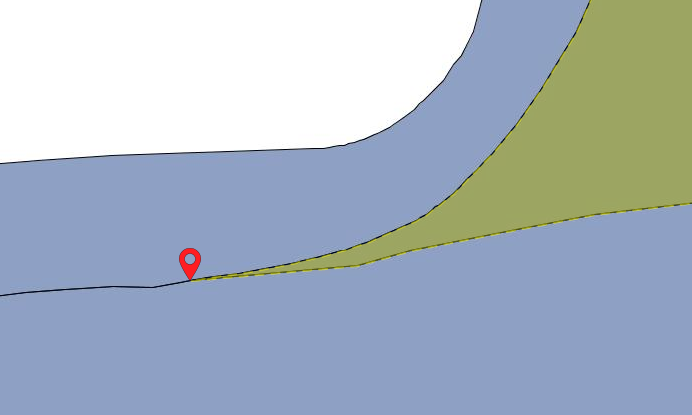
A hotspot marker indicating a non-conformance
Attributes for the currently selected feature are displayed in the Attributes panel.
The Legend tab lists all the layers that are available on the map, with each feature class occupying one layer. Each layer can be toggled on or off to determine if it is displayed or hidden, using the check box next to each layer.
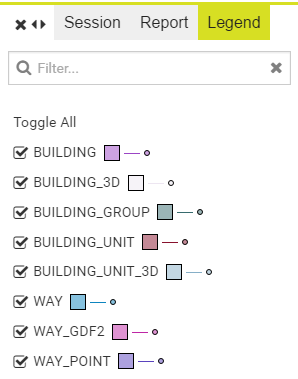
Cache Viewer Legend
Clicking on the colour indicator next to a layer opens the Style Configuration page, which allows you to configure the colour and styling for each layer, determining how features are displayed in the cache viewer.
Within the Style Configuration page, the Advanced tab shows the raw MapCSS definition of the styles specified using the controls on the Selection tab. With knowledge of MapCSS (http://wiki.openstreetmap.org/wiki/MapCSS) you can define more advanced styles than are possible using the user interface, such as labels or symbol fills.
Take care if you are using reserved words when adding labels. Attribute names should be placed in double quotes such as in the example below:
Parcels {
label: [("ID")];
}
Navigation
You can pan the map using the arrows on the pan tool in the top-left corner, or by left-clicking and dragging across the map.
You can zoom using the zoom bar on the left of the screen, or by scrolling with the mouse. Holding the Shift key and selecting an area will zoom to that area on the map.
Measure Tool
To measure a distance in the cache viewer, click ![]() to open the measuring tool (located in the top-left corner, next to the pan tool).
to open the measuring tool (located in the top-left corner, next to the pan tool).
An orange circle appears under your cursor on the map. Click a first point to measure from, then click on a different location to display the distance between this point and the first point.
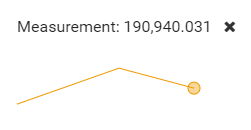
Measuring the length of a line using the measurement tool
Continue clicking points on the map to draw a path to measure, accumulating the distances between each point. Double-click on your final point to finish measuring.
Note: The units of measurement used in the measuring tool are the same as the dataset units (dependent on your source data).
To exit measuring mode, click ![]() again.
again.