Investigating Session Errors
If errors occur when running a session, an error icon ![]() and an error count will display next to the task(s) in which the error(s) occurred.
and an error count will display next to the task(s) in which the error(s) occurred.
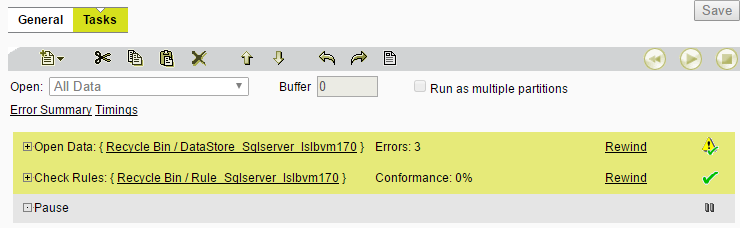
Example session with errors occurring in the Open Data task
The Error Summary page can be accessed from a completed session, via the Error Summary link below the toolbar.
Note: The Error Summary page can also be accessed via the Session tab in the Cache Viewer (see 1Integrate Cache Viewer).
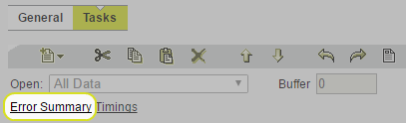
Error Summary link
Opening the Error Summary page displays a table listing any errors, the task within which they occurred, an error message and a count of the number of occurrences.
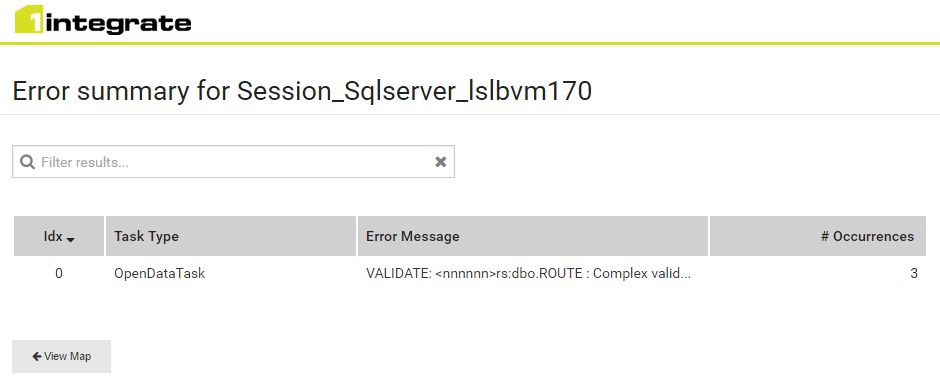
Example Error Summary page
Click on an error message within the table to open up the Error Report and investigate a specific error. The Error Report displays a full error message, stack trace information and instances by class and session.
The page can then be saved, printed or printed to a PDF file using your web browser's standard capabilities.
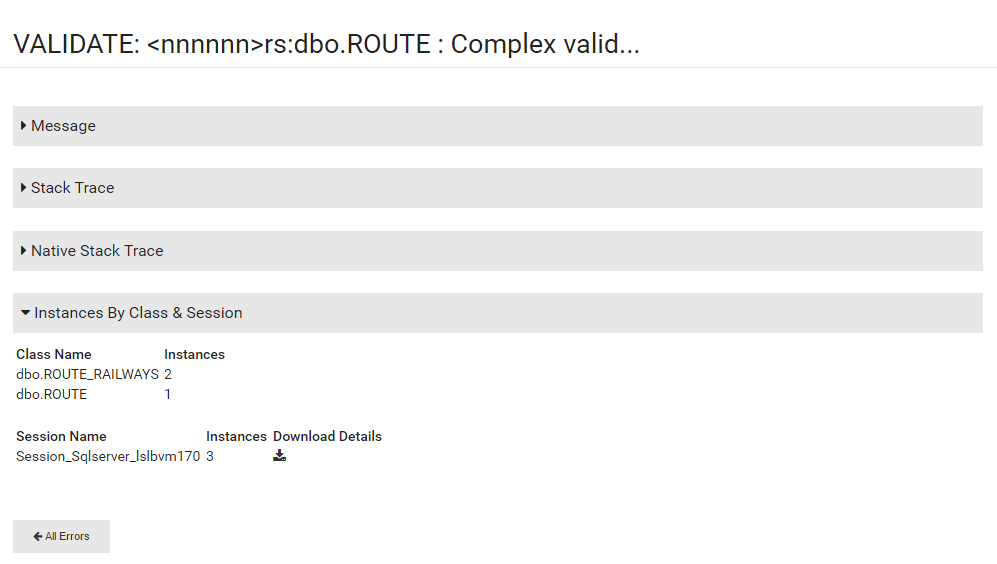
Example Error Report