The 1Integrate Map Viewer allows you to view spatial data related to a 1Integrate Session.
After at least one Open Data Task has run, launch the viewer by clicking the icon either on the Session or next to a specific task.
Note:The Map Viewer is disabled for Sessions using Production Mode.
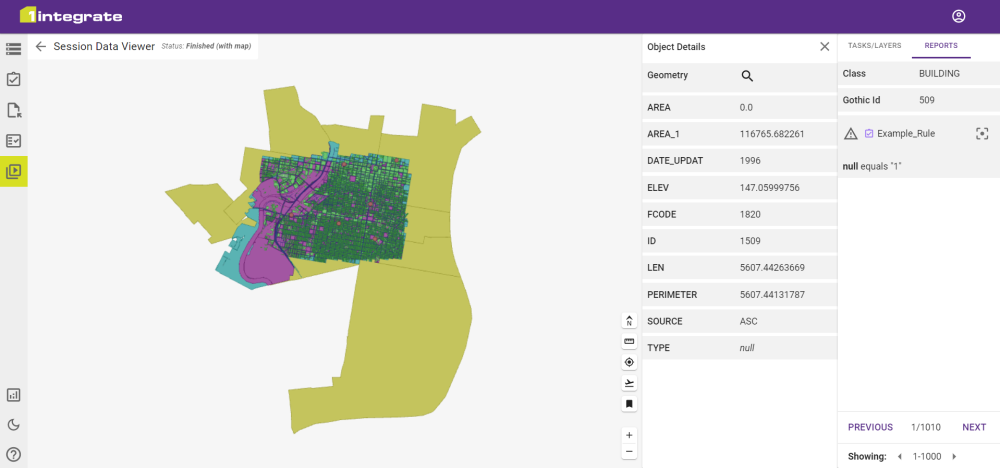
The Map viewer consists of the Map on the left, with the Legend on the right. Clicking a feature will open the Object Details panel to the left of the Legend.
Map Viewer
Legend
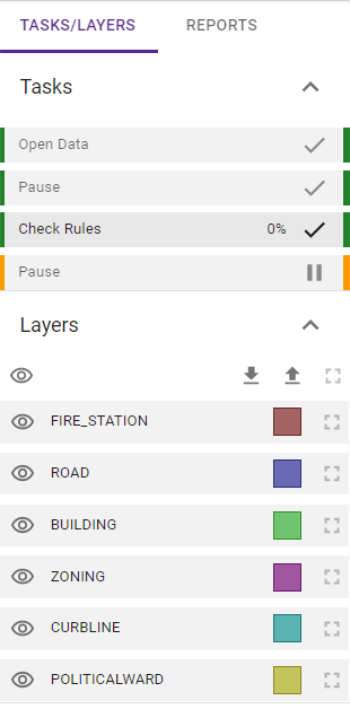
The Legend panel contains the Tasks/Layers tab and the Reports tab if there is one available. Tasks and Layers both manipulate the map to show the states of the data, while the Reports tab gives information on specific features that have failed conformance.
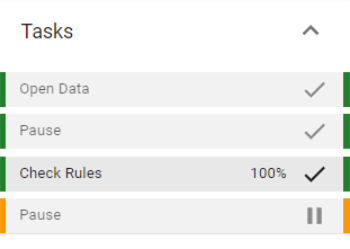
Selecting a Task from the Tasks list will load the Map with the data in the state it was when the task finished. Stepping through the Tasks in order is useful for debugging issues and for showing the evolution of the data.
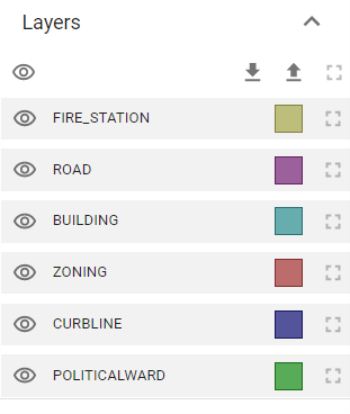
Each feature is displayed as a separate Layer and can be edited on the map. Layers can be dragged up or down the ordering to sit on top of or below other features on the map.
Map Viewer Layers
Clicking on the colour indicator next to a layer opens the colour picker, which allows you to apply a custom colour to that feature.
You can save or load a preferred style by downloading or uploading a JSON file containing the styling:
Click to download a JSON file containing the styles currently in use.
Click to and select a JSON file to upload that contains the layer styles.
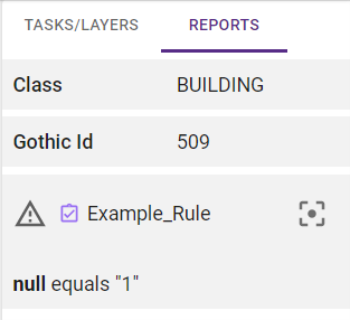
The Reports tab shows all non-conformant objects and/or any objects that were added to a report. For each object, the report panel displays the object's Class, Gothic ID, and the name and description of the Rule(s) the object failed.
Reports Tab (top)
Clicking the icon will select the object and focus the Map on its location.
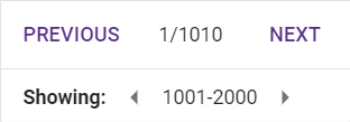
You can navigate between the objects in the Reports tab using the Previous and Next from the bottom of the report tab.
Reports Tab (bottom)
Object Details panel
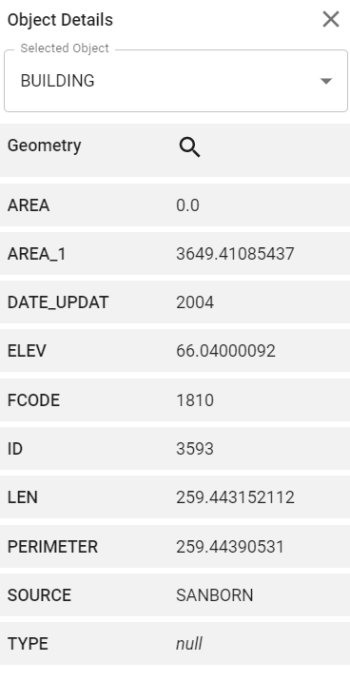
The Attributes and geometry details for the currently selected feature are displayed in the Object Details panel.
The Object Details panel
When clicking a feature on the map, the Object Details panel will open, listing the details of the selected feature. If the object occupies the same space as another object, there will be a dropdown menu at the top where you can select another feature that has overlapping geometry.
Clicking the magnifying glass icon next to Geometry will display a popup with the geometry information.
Map Navigation
You can pan the map using the arrows on the keyboard, or by left-clicking and dragging the map.
To rotate the map, or pan the angle in 3D, hold down Ctrl and drag with left click, or click and drag with right click.
Note:3D in the Map Viewer works with both 2D and 3D data. To unlock Full 3D Support please get in contact.
You can zoom using the zoom buttons on the bottom right of the screen (shown in the table below), or by scrolling with the mouse wheel.
The map icons in the bottom right of the interface perform the following actions:
Icon
Description
Resets the map view to its default view.
Used to measure distance between two or more points on the map. Clicking on the map creates a point. A line is drawn, showing the distance to the mouse. Click again to make additional points, recording the distance between those points. Double-click on the final point or press Esc to stop creating new measurements.
Note:The units of measurement used in the measuring tool are always metres, regardless of the source data..
Click a point on the map and it will copy the co-ordinates to your clipboard.
Enter X and Y co-ordinates and click Fly to centre the map view on the location entered.
Open the Bookmarks dialog. From here:
Create a new bookmark with Add Bookmark.
Focus the map on an existing bookmark with the icon.