
Session Timing Statistics
The Session Timings Statistics page can be accessed from a completed session, via the Timings link below the toolbar.
Note: The Session Timings Statistics page can also be accessed via the Session tab in the Cache Viewer (see 1Integrate Cache Viewer).
Session Timing Statistics link
Opening the Session Timing Statistics page displays a table with a row for each task in the session.
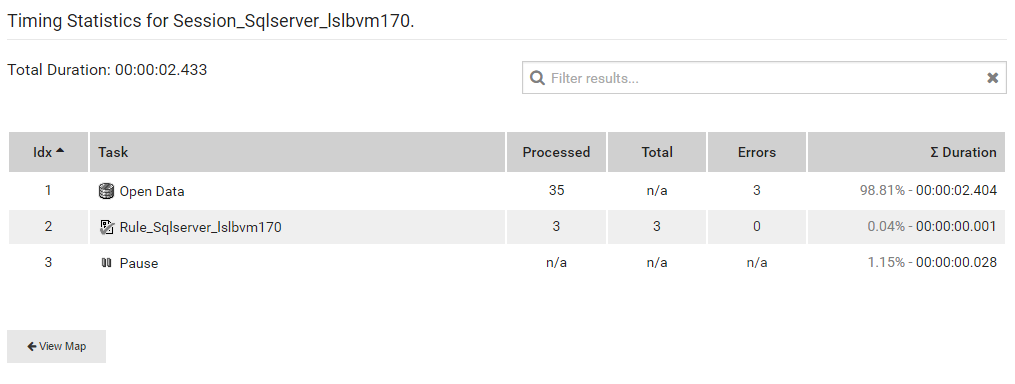
Example Timing Statistics page for a session
Basic statistics such as number of jobs processed, number of errors and duration are displayed for each task.
The View Map button opens the Cache Viewer (see 1Integrate Cache Viewer).
The table can be re-ordered by clicking on any column to sort in ascending or descending order.
Click on a row to view more detailed statistics for a job.
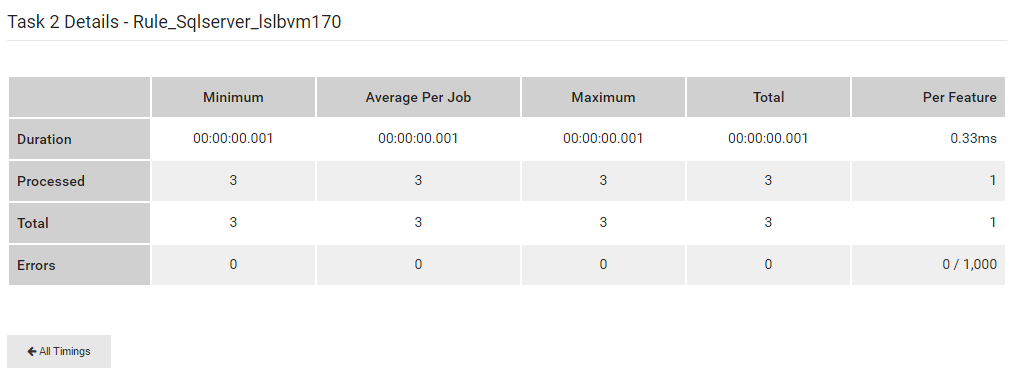
Example task statistics

Copyright © 2017 1Spatial

