

Share Your Success Story and Win

Share Your Success Story and Win
NAAS Project: Automated Route Checking of Trace Network Updates
"What started as a challenge to validate a complex road network at scale became a repeatable, automated process that delivers greater confidence, faster investigation, and more reliable routing outcomes."
Helen Tait - Spatial Analyst | Esk Spatial
Objectives
The NAAS Project is a transformational initiative to provide an Australia-wide routing and access system for heavy vehicles, reducing the need for individual permit applications and improving access certainty for industry.
A critical component of the final product is a web-hosted route mapping application. The accuracy and reliability of the underlying road trace network is essential: if the network is incorrect, heavy vehicle routes may be incorrectly approved, rejected, or diverted.
The road network data supplied to the NAAS project team is updated regularly, and updates to the trace network are planned on a monthly cycle.
The objective of this work was to develop a repeatable and scalable quality assurance process to identify potential errors in a state-wide road trace network after each monthly update cycle, with the longer-term aim of supporting a national dataset.
The key success criteria were to reduce the time required for manual checking, improve confidence in the accuracy of the published network, and identify potential network issues early enough for them to be investigated and corrected before release.
Challenges
To understand the complexity of the challenge, it is important to understand the spatial update process that occurs before the trace network is built.
The base road network dataset is supplied by a third party and consists of linework with basic attribution. Road segments are split at intersections, changes in speed limit, changes in road type, and for many other reasons. Each segment has a unique identifier; however, these identifiers are not persistent and can change between spatial updates when roads are realigned, resegmented, added, or removed.
For the NAAS routing application, each road segment also requires a detailed set of heavy vehicle access attributes. When updated road data is supplied and segment identifiers change, the existing access attributes must be transferred from the previous network to the new one. This is not a simple one-to-one replacement process. One old segment may become many new segments, many old segments may be combined, and realignments may alter the geometry and relationships between segments.
Quality assurance is performed at several stages of the spatial update process, including topology checks such as dangles, missing network nodes, and other structural issues. However, some problems only become apparent when route tracing is performed. A network may appear structurally valid but still produce an incorrect route because of an attribution issue, a missing connection, or an incorrect turn restriction.
One example is the ND_Turns table, which stores prohibited intersection movements. These turn restrictions are manually created where required and rely on road segment identifiers. As part of the spatial update process, these identifiers must be updated to match the new road segments. Because the relationship between old and new segments can be complex, errors in turn restrictions can be difficult to detect through standard checks alone.
Given the number of factors that influence where heavy vehicles can and cannot travel, the most reliable way to identify potential problems is to compare routing results from the new proposed trace network against a known current version of the network. If a route that was previously possible becomes impossible, or if there is a significant increase in travel time, this may indicate an issue in the updated network.
The challenge was scale. A small number of long-distance test routes can confirm broad network traversability, but they are not effective at identifying localised issues. A single incorrect junction may be masked by an alternative route, and changes in travel time may be diluted across a long journey. The question was therefore: how can enough route traces be generated and compared to provide meaningful coverage of the network, while still producing outputs that allow problem areas to be identified quickly?
Solution
Early methods of checking the final trace network were largely manual and provided only a coarse assessment of network traversability. For example, origin and destination points were placed across Tasmania to confirm that vehicles could travel broadly from west to east or north to south. While useful, this approach made it difficult to identify the location of specific problems. The longer the route, the harder it became to isolate the cause of a difference.
The solution was to use FME to create a much finer-grained, repeatable route testing process.
Stage 1: Creating route stop points
The first stage of the process uses an FME workbench to generate a dense set of stop points across the road network.
The workbench ingests the road network, combines line segments based on important network parameters, and creates points at the midpoints of the combined line sections and at network endpoints. This ensures that stop points are located between intersections and at network extremities, allowing localised route behaviour to be tested more effectively.
This stage also uses spatial analysis to identify areas where the road network geometry has undergone genuine and significant change. These areas are delineated as polygons representing the extent of the known geometry changes. Any generated stop points falling within these polygons are removed before the routing analysis in Stage 2.
This exclusion is important because routes beginning or ending within areas of known geometry change are likely to produce expected routing differences, adding noise to the results and making genuine network errors more difficult to identify. Instead, stop points are retained around the affected areas, allowing routes to pass around or across them while beginning and ending on parts of the network that have not materially changed.
As a result, routing differences identified at stops and junctions outside the areas of known geometry change are more likely to represent the types of unexpected errors or discrepancies that the analysis is designed to detect.
The remaining stop points become the input locations for the routing analysis in Stage 2.
Stage 2: Automating matrix route analysis and comparison
The trace network is built using Esri ArcGIS tools. To automate the checking process, the FME workbench uses PythonCallers to access the ArcGIS geoprocessing library through ArcPy. Key script inputs, including source datasets, output locations, and model parameters, are published as FME user parameters so they can be finalised at runtime.
Two parallel PythonCallers are used: one analyses the current trace network, and the other analyses the new proposed network.
Routes are generated using Origin-Destination Cost Matrix Analysis. This method finds and measures the least-cost paths from multiple origins to multiple destinations. In this workflow, the origins and destinations are the stop points created in Stage 1. The user can specify the number of destinations to find for each origin; testing to date has found that using the five closest destination points per origin produces useful results while keeping processing volumes manageable.
The OD Cost Matrix approach is well suited to this task because it is optimised for large numbers of route calculations. Although it does not output the full route geometry, it does return the origin, destination, and travel time, which are sufficient for comparative analysis between the current and proposed networks.
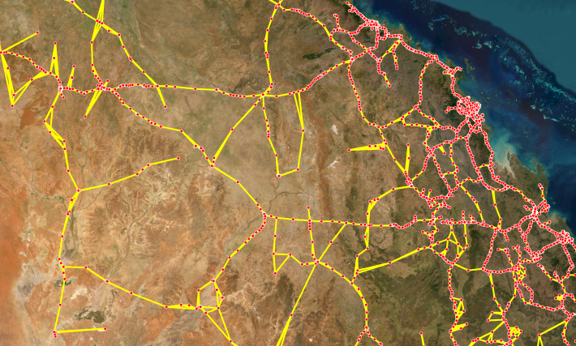
The OD Cost matrix analysis produces a set of straight-line routing results that looks like this across Queensland:
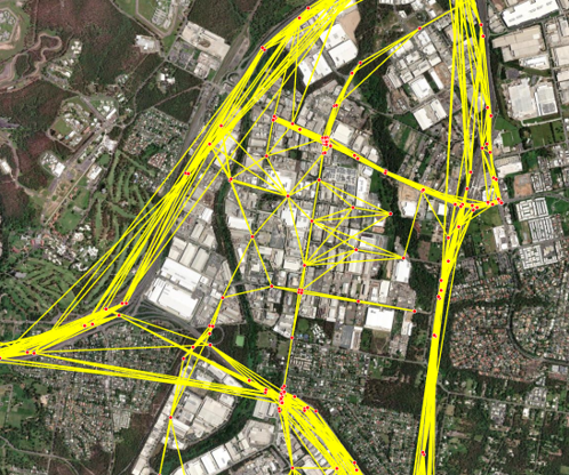
And in more detail:
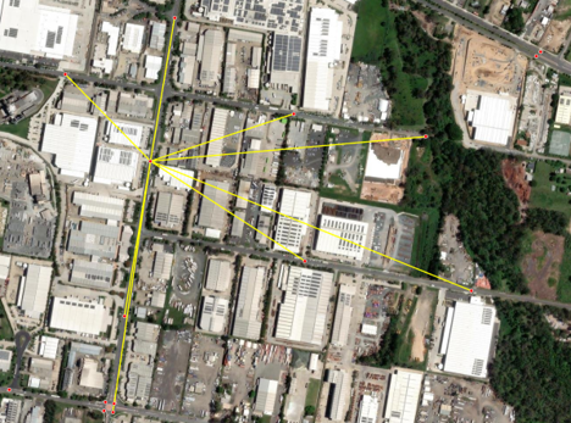
For one selected origin/destination point:
FME then processes and compares the two sets of results to produce two key outputs.
First, where the same origin-destination pair exists in both the current and proposed network results, the travel times are compared. Results with identical travel times are discarded, allowing the review to focus on changed routes. Where a difference is recorded, the origin and destination points are used to create routes for additional analysis.
Second, where an origin-destination pair exists in only one version of the analysis, this indicates that the network change has altered which destinations are closest to that origin. These unmatched results are extracted, together with their associated origin and destination points, for further investigation.
The changed and unmatched results are then combined to create a point table containing the origin and destination points for the routes requiring further analysis. This table provides the input for the more detailed routing undertaken in Stage 3.
Stage 3: Creating full route geometry for problem routes
The origin-destination point table created in Stage 2 is passed into a further pair of PythonCallers, one operating on the current network and the other on the proposed network. These use ArcGIS Route Analysis to recreate the selected routes. Unlike the OD Cost Matrix analysis used in Stage 2, Route Analysis outputs the full geometry of each route.
The resulting route geometries are loaded into a pre-configured ArcGIS Pro project, allowing the corresponding routes through the current and proposed networks to be quickly visualised and compared. This makes it possible to pinpoint where routing has changed significantly or unexpectedly and to investigate the network features responsible for those differences.
The workflow enables comprehensive, fine-grained comparison across the network, identifies road sections where further investigation is most likely to be required, and makes this level of analysis achievable within a practical timeframe.
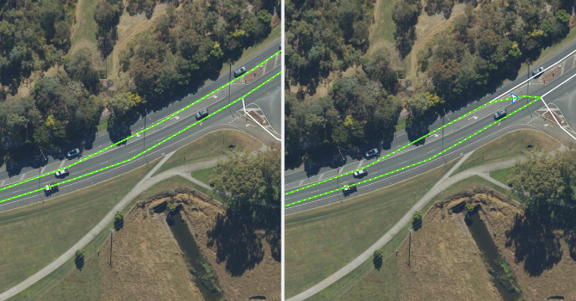
Some examples of the final routing comparisons, visualised in ArcGIS Pro:
Example 1- a right turn slip lane has been added that requires a turn restriction:
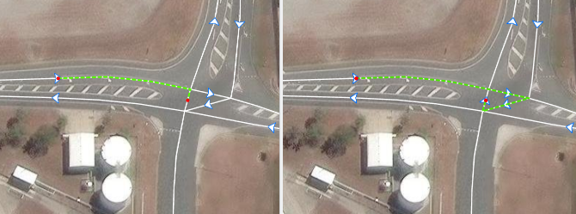
Example 2 - the effect of an addition of a one way direction (one way direction shown as blue/white arrows, stops as red circles):
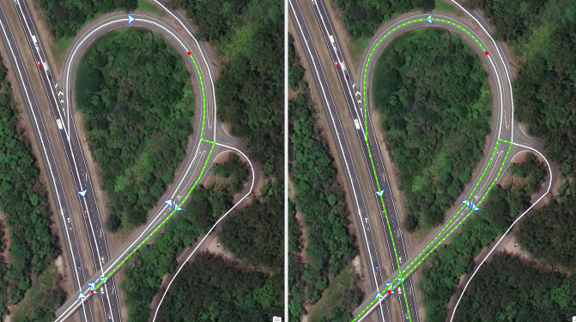
Example 3: The effect of a reversed one-way direction (northernmost arrow symbol):
By combining FME, ArcPy, parameterised processing, OD Cost Matrix analysis, and visualisation of targeted routing outputs, the workflow transforms network QA from a largely manual and coarse checking process into an automated, repeatable, and scalable method for identifying potential routing issues following each monthly spatial update.
Results
The workflow has already demonstrated a significant improvement in the level of network validation that can be performed before publication.
The key measurable outcome is the ability to generate and compare a large number of origin-destination route traces across the network in a repeatable and systematic way. This provides a much finer level of validation than was previously possible through manual route testing or broad regional traversability checks.
Instead of testing a small number of long-distance routes, the FME workflow enables localised testing around intersections, network extremities, and adjacent road sections. This increases the likelihood of identifying routing anomalies caused by issues such as incorrect turn restrictions, missing connections, attribution changes, or errors introduced during the spatial update process.
The workflow also produces targeted visual outputs that make routing differences easier to interpret and investigate. Origin-destination pairs identified as having changed or unexpected routing behaviour are used to generate full route geometry for both the current and proposed networks. These routes can then be visualised and compared directly in ArcGIS Pro, allowing reviewers to pinpoint where routing has changed and investigate the network features responsible.
Evidence of success to date includes:
· automated generation of network stop points for fine-grained route testing
· automated comparison of routing results between the current and proposed trace networks
· identification of routes where travel times differ between network versions
· identification of locations where the set of nearest destinations changes between versions
· automated generation of full route geometry for selected problem routes
· targeted visual comparison of current and proposed routes in ArcGIS Pro to support rapid investigation of routing differences
· creation of a repeatable QA workflow that can be reused during monthly update cycles
The most important result is an increase in confidence in the updated network. The workflow provides a practical way to detect issues that may not be visible through topology checks or attribute validation alone, but which could have a significant impact on routing outcomes in the final web application.
Benefits
The primary benefit of the solution is that it provides a methodical, fine-grained, and repeatable approach to validating the trace network before it is published.
For a national heavy vehicle routing system, confidence in the accuracy of the network is critical. If routing errors reach the public-facing web application, users may lose trust in the system, jurisdictions may lose confidence in the national approach, and the reputation of the project may be affected. This is particularly important in a project that relies on cooperation between multiple Australian states and territories.
The workflow improves decision-making by transforming a complex network validation problem into clear, visual outputs. Instead of manually searching for possible errors across a large road network, reviewers can focus on locations where the comparison between the current and proposed networks shows meaningful differences. This supports more targeted investigation and helps technical staff prioritise areas that are most likely to require attention.
The solution also improves workflow efficiency by reducing reliance on individual knowledge, manual route selection, and ad hoc checking. The process can be run consistently after each spatial update, with user parameters allowing input datasets, output locations, and model settings to be adjusted at runtime.
The groups that benefit most include:
- Spatial data and network modelling staff, who gain a repeatable method for identifying potential routing issues
- QA and project delivery teams, who gain greater confidence in release readiness
- Business and governance stakeholders, who gain assurance that network updates are being checked systematically
- Participating jurisdictions, who benefit from a more reliable national routing dataset
- End users of the web application, who ultimately benefit from more accurate and trusted routing outcomes
Strategically, the solution supports the broader goal of building confidence in a national heavy vehicle access system. It helps demonstrate that complex spatial updates can be tested in a consistent, transparent, and scalable way.
Cost Savings
The workflow has delivered cost efficiencies by reducing manual effort, reducing rework, and lowering the risk of errors being discovered late in the release process or after publication.
The main financial benefit is the reduction of risk and rework. By identifying potential routing issues before publication, the workflow helps avoid the much greater cost of investigating and correcting errors after they have reached the web application. Without this workflow, a comparable level of fine-grained route validation would be impractical to perform manually. Staff would either need to rely on a much smaller sample of manual route checks, increasing the risk that errors would go undetected, or invest substantial time in repetitive testing that would still be difficult to perform consistently across the network.
By automating the generation, analysis, and comparison of route traces, the workflow reduces the need for manual selection and testing of routes. It also helps focus investigation effort on locations where differences have actually been detected, rather than requiring reviewers to search broadly across the network.
Potential cost efficiencies include:
- Reduced manual effort in route testing and comparison
- Reduced rework by identifying potential issues earlier in the update cycle
- Reduced risk of publishing routing errors to the web application
- Reduced need for reactive investigation after user-reported issues
- Improved use of specialist staff time by directing attention to likely problem areas
- Creation of a reusable workflow that can be applied to future monthly updates
The return on investment is therefore best understood not only in terms of immediate labour savings, but also in terms of risk reduction and quality assurance. The workflow helps protect the credibility of the project by reducing the chance that significant routing issues will reach production.
Time Savings
The greatest time saving is achieved in the route validation and investigation process.
Previously, checking the trace network relied on relatively coarse manual testing, such as selecting origin and destination points across broad areas of the network and confirming that routes could be completed. While useful, this approach was time-consuming, subjective, and limited in coverage. It was also difficult to use long-distance route results to identify the precise location of an underlying network issue.
The FME workflow allows a much larger number of localised route comparisons to be generated automatically. It also removes much of the manual effort involved in preparing test locations, running equivalent checks against two network versions, comparing the results, and producing outputs suitable for visual review.
The tasks with the greatest time reduction are:
- Creation of route test points across the network
- Running repeated origin-destination routing checks
- Comparing current and proposed network results
- Identifying routes with changed travel times
- Identifying locations where reachable destinations differ between network versions
- Preparing visual outputs for review in ArcGIS Pro
The time savings are especially important because the trace network is expected to be updated monthly. A manual process that may be manageable once becomes much less practical when it must be repeated regularly and eventually scaled from a state-wide dataset to a national one.
By automating the most repetitive and technically complex parts of the checking process, the workflow allows staff to spend more time interpreting results and investigating genuine issues, rather than preparing tests and manually comparing outputs. This improves productivity and supports a more reliable release process for future network updates.
Tips / Lessons Learned
One of the key lessons from this project was the importance of developing a robust and repeatable method for checking routing outcomes, rather than relying only on structural or attribute-based QA checks. For a complex trace network, the most important question is not simply whether the data appears valid, but whether the network behaves as expected when routes are calculated.
The project also highlighted the importance of distinguishing between expected and unexpected routing changes. Where the road geometry has genuinely changed between network versions, routing differences are to be expected. Identifying these areas in advance and removing stop points that fall within them helps reduce unnecessary noise in the results, allowing the analysis to focus more effectively on differences that may indicate genuine network issues.
A further lesson was the value of using different network analysis methods for different stages of the checking process. OD Cost Matrix analysis provides an efficient way to compare large numbers of origin-destination relationships across the network and identify routes that warrant further investigation. Full Route Analysis can then be applied only to this smaller set of problem routes, producing detailed route geometry that can be visualised and compared directly in ArcGIS Pro. This provides both the scalability required for broad network testing and the level of detail needed for targeted investigation.
The project also demonstrated the benefit of combining FME’s data transformation and workflow automation capabilities with ArcPy geoprocessing. FME provides the framework for preparing inputs, managing parameters, processing and comparing results, and passing selected outputs between stages, while ArcPy enables automated access to Esri’s network analysis tools. Together, they allow a complex routing QA process to be automated in a way that would be impractical using manual methods alone.
For organisations considering a similar approach, the main advice would be to design the checking process to be repeatable from the beginning, particularly where datasets are updated regularly. It is also important to consider both the efficiency of the initial analysis and the way identified differences will be investigated. The value of the workflow lies not only in detecting potential routing issues, but in progressively narrowing the results and presenting them in a form that allows reviewers to quickly understand where and why routing behaviour has changed.