Exploring Automation: Local Road AADT Calculations to Support MIRE

Exploring Automation: Local Road AADT Calculations to support MIRE
Published: March 27, 2025
Our project with the New Hampshire Department of Transportation (NHDOT) is an exploratory exercise aimed at understanding the unique needs of our customer and adapting an existing proven workflow to meet those needs. By leveraging our technology, 1integrate, we worked collaboratively with NHDOT to automate processes traditionally handled manually. This initiative demonstrates the potential of automation in enhancing data aggregation, validation, cleanup, and estimation, while providing cost-effective solutions to meet the upcoming Model Inventory of Roadway Elements (MIRE) requirements.
Understanding MIRE
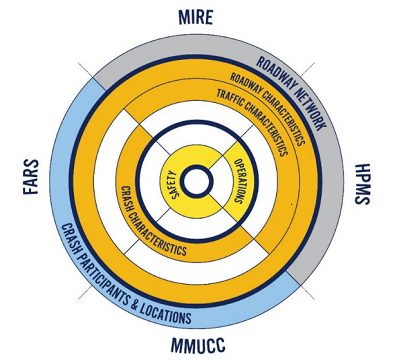
MIRE is a model and set of requirements set forth by the Federal Highway Administration (FHWA), which aims to list roadway data elements along many more miles of the US’ public roads than previously required or collected. The MIRE inventory model is similar to the Highway Performance Monitoring System (HPMS), but whereas HPMS data items focus on roadway operations, MIRE focuses on elements of roadway safety, including crash, intersection, and traffic data, to name a few. Another big difference from HPMS is that MIRE (specifically the newly released MIRE 2.0) requires data elements to be collected and reported on many more functional classes, including some elements on all public, local roads. The MIRE Fundamental Data Elements are critical for analyzing crash experiences on roadway networks relative to expected average crash frequency given the roadway and traffic characteristics at each location.
Adapting Proven Methods with Automation
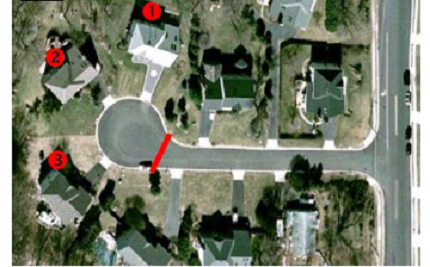
Inspired by a successful case study from the Virginia Department of Transportation (VDOT), developed in collaboration with FHWA, New Hampshire DOT (NHDOT) approached us and asked to develop a pilot project to automate VDOT’s procedure. We worked with NHDOT and adapted this methodology using 1integrate to automate the process. VDOT’s original methodology estimated trip counts from buildings using aerial imagery. GIS analysts at the DOT assigned buildings to nearby roadways and summed the number for each segment. To more accurately estimate the number of trips on the entire roadway, VDOT split “bulb” and “stem” buildings for roads which ended in cul de sacs. Any building connected to the stem would be given a half value, and any connected to the bulb would be given a whole value. From there, they used the number of buildings on the road, and multiplied that by the expected number of trips per building, approximately 10 per day.
This allowed VDOT to estimate the trip and therefore traffic counts on local roads without having to do costly traffic studies. However, it of course is still a time-intensive and subjective process, requiring analysts to manually review lots of imagery.
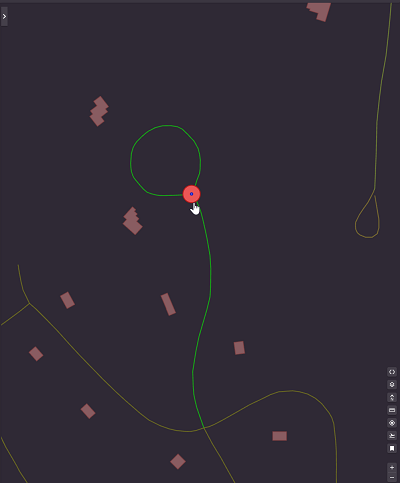
Through the pilot project, we adapted VDOT’s process by using NHDOT’s state roadway data and Microsoft building footprints instead of imagery and applying a matching ruleset to match the buildings to nearby roads. From there, the most interesting challenge was finding where a bulb or stem of a road is without manual intervention. We authored an action in 1integrate to find and buffer the end of the road, split the road with that buffer, and from there, if the resulting split road was multipart, it would be considered a circle. After determining that the endpoint was at a circle, we could use bearings at that endpoint to extend the road out, and determine which “part” of the split roadway was the bulb and which was the stem. Lastly, we applied the same multiplier used by VDOT to calculate the trip counts on each road.
Our approach offers several significant theoretical advantages:
- Cost Reduction: Automation minimizes the need for manual labor, significantly reducing costs.
- Time Efficiency: Automated processes are faster, allowing for quicker data aggregation, validation, cleanup, and estimation.
- Improved Consistency: Automation reduces human error, ensuring more reliable and consistent data outputs. Configurable rules means that it’s easy to see exactly the steps leading to the final calculations.
- Scalability: Automation makes the process scalable, enabling the coverage of larger areas or additional datasets without a proportional increase in time or cost.
These benefits not only streamline the workflow but also free GIS analysts and other professionals to focus on more complex and strategic activities, enhancing overall productivity and innovation.
Our pilot project with NHDOT is a testament to the transformative potential of automation in transportation data management. As we continue to adapt and innovate, we are committed to providing DOTs with the tools they need to meet regulatory requirements and achieve operational excellence.
We will be presenting on this at the GIS-T 2025 Symposium on April 8th at 2 pm PST. This presentation will be invaluable for anyone involved in generating data for MIRE requirements, showcasing how automation can revolutionize traditional methods and pave the way for a more efficient and reliable future.