

What is geospatial data and how is it used?
What is geospatial data?
Geospatial data means any data that describes something based on its location. Typically, this means somewhere on earth, though it could be on another planet or on virtual worlds such as in games or the dreaded metaverse.
Geospatial data is also known as location-based or spatial data but is also sometimes named GIS data after its traditional management tool: Geographic Information Systems.
How geospatial data is used
The most obvious use of spatial data is for producing maps - in fact reducing effort in map production was one of the original drivers for creating digital spatial data back when updating a paper map required hand drawing or re-engraving a copper printing plate. Maps and navigation are still very visible uses for spatial data but much of the use is by services for which the data is less visible and there are thousands of these other uses for example managing utility networks or monitoring the environment.
Types of geospatial data
The data that you are used to seeing on a digital map is either unstructured raw data (i.e., aerial photos taken from a plane, drone, or satellite) or structured 'vector' data (I.e., points, lines, polygons, and solids) drawn with specific colours, widths, and symbols. One way to consider whether data is structured or unstructured is to imagine what would happen if you clicked on the map and asked, 'what is here'. If the data can just tell you a pixel colour or height or Infra-Red frequency, then it is unstructured data. If the data can tell you 'This is a building with X footprint and Y size and it has these attributes (such as type or age)' then it is structured data.
Geospatial data - lines, points and polygons
Structured vs unstructured data
Structured data is very powerful for analysis and automation and therefore unstructured data is usually refined (by humans or, increasingly, automatically) into structured data which can answer these more powerful questions.
This structured data can still be used to draw maps for human interpretation, but it also opens up all sorts of uses from reducing traffic congestion through to predicting biodiversity loss or planning where to build a hospital. There are so many disciplines which can make use of this data and not all of them do so yet: Government, Planning, health, environment, utilities, land management, commerce, transport, emergency services - the list is endless. Many modern services such as Uber, Airbnb, and Google Maps are powered by this type of structured spatial data, especially with more widespread adoption of 3d data not just for creating initial designs but as the ongoing national spatial datasets.
Spatial data vs non-spatial data
If a point location can be described by just two numbers, such as a longitude and latitude, then what makes it any different to non-spatial data you typically find in a spreadsheet or database? It's because not only is a point represented by two numbers but also that features in spatial data have more complex shapes (known as geometries) which are often represented by more than just a single point e.g.:
- A road is often represented as a line made up of a list of points
- A land parcel is often represented by a polygon which is the area inside boundary lines formed by closed loops.
- A building is often represented by a solid which is a 3D shape enclosed by a shell of polygons.
Dedicated spatial indexes
In order to efficiently search through spatial data to answer questions such as 'where is my nearest ___?' then the software needs efficient search algorithms and indexes. Non-spatial values rely on the fact that they are one-dimensional i.e., they can be listed in a single order (such as the index of a book, which is alphabetical). You can order most simple non-spatial values such as text, numbers or dates but there isn't a simple order for point, line or polygon geometries because they are multi-dimensional. Dedicated spatial indexes are needed to rapidly search that data and make it usable.
Comparing spatial geometries
Spatial geometries also have much more complex types of interaction: Comparing a date or a number with another will only tell you whether it is less than, the same or greater than the other (and the difference between them). Comparing geometries enables more complex - but more powerful - concepts such as 'inside', 'crossing' or 'on the boundary of'.
Where does data come from?
Geospatial data is collected in a number of ways, typically:
- Good old-fashioned surveyors on the ground using a range of devices
- Remote sensing devices attached to drones, planes, satellites or other forms of transport
- Capturing or converting from paper maps, or the raw sensed data
- Inferring or transforming from crowdsourced data or existing vector data
Once collected, the data is stored/used/shared/transformed using many different technologies and into many different forms for a range of different uses. The data is stored in a number of different formats: Typically most databases can store spatial data now - plus newer big data technologies are starting to add spatial data capabilities as well and often data is exchanged or streamed via web service APIs.
Spatial data is usually mastered by local or national organisations who capture, maintain and publish this data.
Data accuracy and quality
When managing spatial data, one question is how you agree on WHERE exactly a coordinate is in the real world - that is defined by the surprisingly complex world of coordinate reference systems. The world is not flat, but neither is it perfectly round. It's best approximated as an ellipsoid (a 3d oval) but it's not truly that either: It's an irregular shape with varying density, so there is always some uncertainty and simplification going on.
Further reading:
- Geospatial data quality
- Geospatial data governance
- Geospatial data validation
- Geospatial data cleansing
Simplification
However, when dealing with localised data, such as a country the size of the UK, then treating the earth as flat makes it much easier to calculate the distance between two points because you can rely on a 2,500-year-old formula that you were taught at school. The simplification gives much simpler and faster calculations even if it means they are very slightly wrong at the far extremes of the flat grid (which in the UK luckily are mostly out at sea). But to deal with single datasets that span large countries or the whole world then it is not possible to flatten things for simplicity.
So even the definition of 'where' something is has ambiguity and simplifying assumptions, but it is still possible to have data that is high quality and consistent, as long as those assumptions and simplifications are well described and understood.
Extracting meaningful results
Another aspect of quality is the level of precision – in other words, the number of decimal places to which the data has been captured as well as how much of that detail you actually store. The best positioning technology can capture absolute position down to a centimetre or two, but data is also simplified and so precision is undermined when combined with other data that is only accurate to half a metre (which much historically captured data tends to be) - added to which continents can move relative to each other by a few centimetres a year.
In fact, the quality of data is not just about the accuracy or precision of the position: how the data is encoded, the attributes of the features and the relationship between the different features in the data are all part of the wider story of spatial data quality, which is an important aspect to measure, improve and manage to enable meaningful results from services that use it, each of which may have different needs.
The benefits of spatial data
The great thing about spatial data compared to non-spatial data therefore is that the multi-dimensional aspect provides powerful capabilities for automating processes and analysis. One of Toblers laws of geography is that ‘everything is usually related to all else but those which are near to each other are more related when compared to those that are further away’.
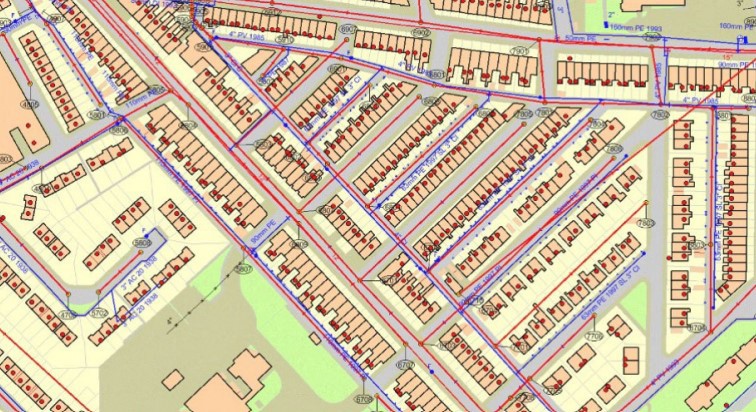
In other words, spatial data enables implicit links between different datasets just through the location. I can infer the material of the pipe providing water to my house by combining the dataset of the pipe network with the datasets of buildings and addresses, based just on the proximity of the pipe to the building. It is these implicit links provided by spatial data which makes it so powerful compared to non-spatial data.
In short, the benefits of geospatial data can be summarised as follows:
- Uncovering underlying relationships between data through spatial patterns and trends
- Improved insights and analysis due to location-based data that can be segmented and filtered
- Enhanced ability to represent the real world, often in real-time (for instance with digital twins)
- Better decision-making due to improved data insights
Use cases of geospatial data management
Geospatial data requires a specific set of skills, combined with specialist technology, to ensure the continued management throughout its lifecycle. Visit our case studies page to see some examples of how spatial data can be managed effectively across a range of sectors.
(Authored by Seb Lessware, Chief Technical Officer, 1Spatial, with input from Curtis Black and Ryan Gallagher, spatial data consultants at 1Spatial).
Free Download: Geospatial Data and Digital Transformation: 5 Key Challenges and Opportunities
Download this comprehensive guide on how to make the most of geospatial data and ensure the success of your digital transformation projects.
Read it now