

1Spatial and 3D: Lessons to be learned from 2D
1Spatial and 3D: Lessons to be learned from 2D
The GIS industry has come a long way in the 50+ years since 1Spatial was first founded. Our 3D Product Manager, Chris Evans takes a retrospective on his vast experience in traditional 2D/2.5D GIS and explores how we are applying these lessons to our approach in developing 3D products and solutions.
How has GIS changed since you first joined 1Spatial?
35 years ago, spatial data was primarily used for generating paper maps or presentation on screen. Analysis was confined to simple data queries, or revolved around thematic mapping and visual inspection of the results.
In these early days, spatial data was mainly made up of points and lines representing the physical boundaries of features, with potentially different styling for each edge. Part of the reason for this was that many of the early GIS pioneers were based on CAD (Computer Aided Design) technologies. The source data was mainly based on historic paper maps and so took the form of 2D lines with no height attribute. If we were lucky, land parcels would be represented as a ring with a flag to indicate if it was closed.
As the main use-case was making the data “look good” on screen or paper, data quality was secondary. If it “looked right” was often good enough and topological data quality issues were plentiful; for example, lines not being connected correctly and border rings not being closed.
This type of modelling made analysis unreliable and slow with even a simple area check or containment test involving building a valid polygon from the constituent linework on-the-fly. The understanding that to make the data “smart” by holding polygons was slow to be adopted and was an expensive process to retro-fit. Mapping agencies engaged in multi-million pound projects to change models, formats and tools to generate polygons from the existing linework and create the more reliable, smarter data that we now depend on.
What do we really mean by “3D”?
We’re now seeing an upsurge in interest in 3D data, and I get a strange case of Déjà-vu. “3D” in GIS is another one of those catch all terms. It can mean data that follows a terrain (heighted data or 2.5D) or underground assets, point clouds from LIDAR systems and finally 3D building data – let’s explore that last one in more detail.
The main 3D use-cases being demonstrated currently are again visual: “Look, we can generate a photo-realistic modelling of a city”. Various bodies are working on capturing the shape of buildings as automatically as possible based on LIDAR and photogrammetric methods. However, analysis is once again visual, based on the building outlines: “Here is the line-of-sight analysis from this window”, or “this is the effect of adding this building”, or “let’s show a slice through the building”.
If you look carefully though, again, much of the data being held is just the boundaries. Often the data model consists of holding the outer skin of the building as a mesh (a series of polygons representing the visible parts of the building). This echoes back to the idea of holding the linework that makes up the 2D land parcels.
Part of reason for this is that much of the viewing technology used is taken from the gaming industry, which focuses on the visuals and making it “look good” (sound familiar?), and the mesh model approach that they used. It is also partly the case that some GIS data formats have been slow to adapt to the demands of true 3D. Systems provide tools to check if a mesh representing a building is closed and, if you’re lucky, will convert it to a true volume. This means you can perform spatial checks, but they are limited and done at run-time which is slow. Again, quality wise, topologically correct data is optional – for most of the use-cases, visually correct data is all that is required.
What do we mean by a closed volume?
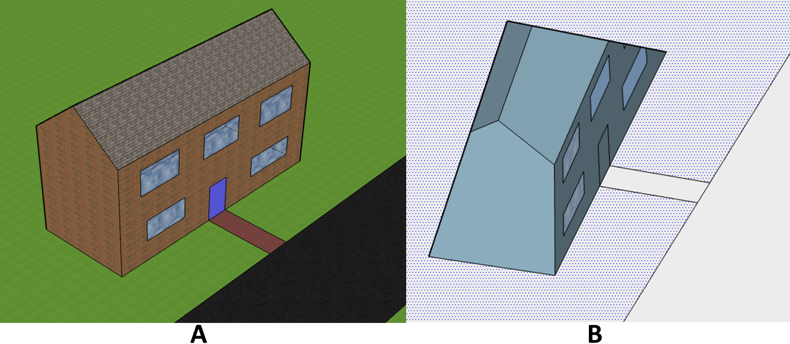
In the same way as in 2D a polygon is made up from linework that exactly touch and form a leakproof ring, the same is true in 3D. In the diagram below, image A looks like a detailed model of a building, but in reality as shown from below in image B, there is no base. The building is held as a shell and there is no closed solid volume to represent the building itself.
35 years ago it was realised that it was better to hold parcel data as polygons so that you could improve the data quality and perform proper analysis. So, surely the same must be true now and we should store 3D features as the volumes that they really represent?
There is a lot of talk about smart cities and the data that underpins it. It is my contention that mesh-based 3D data is of limited use in analysing such environments and is only of use in presentation of the results. With a mesh-only model of a building you cannot directly perform containment checks and you cannot directly determine the volume of the building. In fact, you cannot even assume the mesh forms a closed “water-tight” building in the first place.
The OGC was ahead of the curve here and CityGML encourages the storing of true volumetric data, but CityGML is a transfer format and this attitude of “volumetric first” needs to be promoted into the application and internals models.
BIM/IFC models are often discussed as the basis for geographic 3D models and there is value in this, but it has to be remembered that BIM is used to literally model the bricks and mortar of a building. Again, it models the boundary of the rooms and building in great detail and the actual living space is optional. When doing analysis on a large scale generally we’re potentially interested in the void and not the details of the boundary, and this extra detail in the boundary makes the analysis unscalable.
So, what can we learn from history?
What we discovered with 2D still holds true:
- Polygons allowed for enhanced automated analysis of data and the same is true in 3D volumes/solids.
- Leaving this process of adding solids to the models is possible, but the process will involve data fix-ups, and the sooner this is done the better.
- Changing the model and cleaning the data will be disruptive to customers if they’ve been using it for a while.
In the same way as holding land parcels as polygons added so much value in the 90s, holding building and property data as solid volumes is core to underpinning a greater use of 3D in performing valuable analysis. History has taught us that as we move into the 3D world, regarding volumes as core to the data model is essential both for cost of production but also for potential uptake for performing smart city analysis. Let’s face it, the first question we’re asked when someone installs central heating is “what volume are the rooms” not “what does the building look like”.
If you would like to discuss this further, please get in touch.