World GIS Day - 10 Day Countdown!

10. Mark your calendar, put a reminder in your phone. World GIS Day is coming!
Wednesday 14th November is GIS Day and one day later, 15th November will see the Smarter Data, Smarter World conference at the Imperial War Museum, London.
GIS Day is designed for people to learn about geography and the uses of Geographical Information Systems (GIS). First held in 1999, it’s now an international, grassroots celebration of how GIS transforms our lives every day, often impacting upon real-world applications and making a difference to our society.
Today, 19 years after the first event, demand for GIS and the geospatial data that fuels these systems has never been greater. The growth is driven by the increasing availability of raw data (think smartphones, wearable tech, internet of things, GPS, sat nav, social media … you name it), greater and cheaper processing power (cloud computing) and even more applications that use, need and generate location-sensitive data.
We see it every day. As a geospatial solutions provider and a global leader in managing geospatial data, we work with organisations in all sectors helping them innovate with GIS. Innovation that can be key to driving business success and improving the way people work on a day to day basis. Read more about the examples of this innovation aimed at increasing data quality the value of data.
9. The first maps: putting the “G” in GIS
So, what is a GIS?
A GIS is a system that captures, stores, analyses, interprets or presents location (geospatial) data.
The very first such systems were, of course, simple, two-dimensional representations of geographic reality; i.e. maps. And, here’s a thought: the earliest maps pre-date writing by over 20,000 years!
An engraved mammoth tusk found near Pavlov in the Czech Republic, and dated to around 25,000 BC, shows the line of the river, the mountain range and, perhaps, a plan for hunting mammoth. For the prehistorically-minded, there is an excellent academic paper, here. By contrast, the origins of writing are generally dated to around 3,400-3,300 BC.
By the time of the Ancient Babylonians, map-making had become more advanced. A clay tablet dated around 2,300 BC shows the cardinal directions (north, south, east and west – essential for orientating the reader) and used surveying techniques (see page 113, here). Babylonia also gave us the earliest surviving world map, from around 600 BC.
At every stage of development, the evolution of GIS has been driven by economic value. Where is the best mammoth-hunting? Who owns this land? Where are the important trade-routes? How can I make deliveries more fuel-efficient? GIS and the underlying location data are powerful enablers of economic value.
8. John Snow adds the “I” 
Geographic, or geospatial, information is central to GIS, but even greater value and insight come when you can associate other data with its spatial dimension. As the old geospatial adage goes: everything happens somewhere.
In the nineteenth century, people began layering data onto maps to reveal new insights. One of the best-known examples – which we discuss in our Little Book of Spatial Data Management – is Dr John Snow’s 1854 map of cholera deaths in London.
At the time, it was thought that cholera was caused by “bad air”. But, when Snow plotted deaths in the Broad Street area – stacking a bar for every death at each address like little histograms – a different picture emerged. He saw that the deaths were concentrated around a single public water pump on the corner of Broad Street and Cambridge Street. Disabling the pump ended the epidemic and led to new thinking on the source and cause of the disease.
Another pioneering example of geospatial infographics is Charles Minard’s 1869 map of Napoleon’s 1812-13 advance on, and retreat from Moscow. In this famous combination of map and time-line, Minard succinctly plotted six different data series: the size of the army (and consequently its losses at key points), its location, distance travelled, the direction of travel, key dates and temperature. Described by statistician and data visualiser Edward Tufte as the best statistical graphic ever, the map shows the army shrinking progressively from its initial 422,000 to just 10,000 when it finally returned to Poland. Catastrophic events like the crossing of the Berezina River, where Napoleon lost 36,000 troops, become starkly apparent in Minard’s pioneering map.
7. Roger Tomlinson, father of GIS 
If John Snow was the “I”, then Dr Roger Tomlinson was undoubtedly the “S” in GIS.
Born, like us, in Cambridge, England, Roger Tomlinson (1933-2014) is generally regarded as the father of GIS. He completed his PhD at University College London (UCL, which last year established the Roger Tomlinson Prize in his honour) but his pioneering work was done in Canada.
It was in Canada in the 1960s that he conceived the idea of combining mapping with the then emerging field of computer technology to create the Canada Geographic Information System, the world’s first computerised GIS. As a result, in 2001, Tomlinson was awarded Canada’s highest civilian honour, the Order of Canada (OC).
In making the award, the Canadian Government described Tomlinson’s work: “he pioneered its [GIS’s] uses worldwide to collect, manage, and manipulate geographical data, changing the face of geography as a discipline.”
From the outset, the combination of mapping and computing necessarily placed the collection, management and manipulation of geographic (geospatial) data right at the heart of GIS.
As the volume and the velocity of geospatial data increases, the challenge of collection, management and manipulation grows. More data certainly means greater opportunity, greater potential insight … but only if the underlying data can be managed effectively.
6. The state of GIS today 
In the last 50 years, the world of GIS has grown enormously. In 2017, the global geospatial industry was valued at $299.2 billion, according to the 2018 Geospatial Industry Outlook and Readiness Index published by Geospatial Media and Communications.
The estimated value for 2018 is $339.0 billion and the industry is forecast to grow at an accelerated rate of 13.6% CAGR between 2017 and 2020. By 2020, the geospatial industry will be worth $439.2 billion.
Within this forecast, the GIS and Spatial Analytics sector is expected to grow at a rate of 12.4%:
“…as it finds growing adoption in city planning, utilities management, e-governance, applications, retail and logistic sector, disaster management and various other applications. More and more business data integration with location information across enterprise level functions, engineering-construction-infrastructure sectors graduating to using spatial analytics, deepening integration of Big Data with GIS, the Spatial Analytics industry is poised for greater growth by the demand for adding location context to data.”
5. GIS goes mobile 
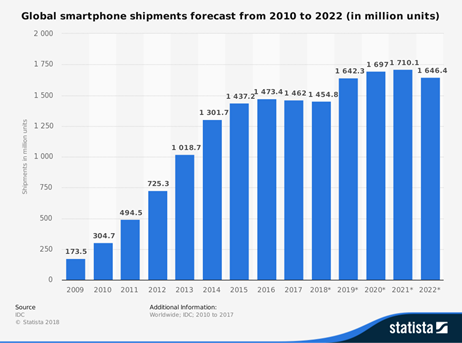
One of the drivers of growth for GIS and geospatial generally, is the prevalence of smartphones. In 2018, worldwide, total smartphone shipments will reach a staggering 1.45 billion – a tenfold increase since 2009. Almost one third (31%) of the world’s population now has a smartphone.
In the UK, 75% of all online time is spent on a mobile device (according to the latest Communications Market Report from Ofcom) and 78% of people now use a smartphone. That’s a huge amount of location data.
According to US research from the Pew Research Center, nine out of ten smartphone users leverage location services. As a result, smartphone users are consumers and producers of huge volumes of geospatial data which, in turn, feeds demand for yet more GIS-led innovation.
In business too, smartphones (and tablets) are so common and cost-effective, they find ever more uses. Many of our clients are exploring ways to make their large, field-based workforces more effective using mobile technology. These include: National Trust, Environment Agency, Rural Payments Agency and Ordnance Survey Ireland.
4. The Internet of Everything, everywhere
It’s not just mobile, and it’s not just “things”. Beyond the Internet of Things sits the Internet of Everything – a concept coined by Cisco, back in 2013.
The Internet of Everything “is bringing together people, process, data, and things to make networked connections more relevant and valuable than ever before-turning information into actions that create new capabilities, richer experiences, and unprecedented economic opportunity for businesses, individuals, and countries.”
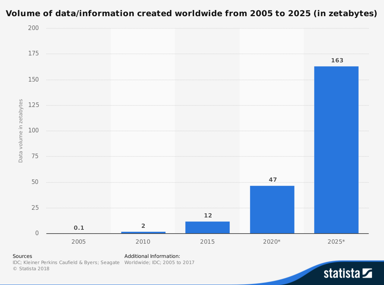
People, process, data and things. There are estimated to be 23.1 billion connected “things” worldwide in 2018, rising to 30.7 billion in 2020 and 75.4 billion by 2025. Those things (sensors, health trackers, locks, even lightbulbs) processes and people are all generating and consuming data. That data is all, necessarily, location-sensitive.
More than that, each of those people, processes and things will generate an increasing volume of data as systems become more powerful. No wonder that forecasts show the volume of data created increasing exponentially. From “just” 12 zetabytes of data created in 2015, IDC estimates that 47 zetabytes will be created in 2020 and 163 zetabytes in 2025.
3. Drones, satellites and data capture 
Launching and operating a satellite like the Landsat 8 imaging satellite costs just short of $1 billion. A commercial light aircraft costs several hundred thousand dollars, while a professional-grade mapping drone might cost just $20,000-30,000.
Little wonder that engineering firms are now delighting clients with detailed aerial photogrammetry (and often struggling to manage new volumes of data in the process).
As the cost of data collection falls, applications of GIS will expand. The challenge will not then be the availability of data, but its management; the taming of that data to extract usable insights. The internet of everything will enable decisions to be made better and faster, often automated based on real-time and near real-time information.
But, managing data quality could become an enormous challenge. Historically, managing the quality of geospatial data has been a largely manual, expert-intensive process.
Today, the volume and pace of geospatial data means that these processes must be automated as much as possible. Otherwise, those faster, automated decisions will be based on inaccurate and outdated data. In large part, that’s what we do at 1Spatial. We believe that smarter data makes for a smarter world and our rules-based technology is designed to automate data management and data quality routines – making data smarter, as efficiently as possible
2. GIS meets AR 
They say everything happens somewhere, but some things haven’t happened there yet. And other things happened a very long time ago. Augmented Reality (AR) technology, coupled with location data, adds layers of past, future or fantasy onto current reality.
Like so many cool technologies, AR is quietly becoming everyday. When you watch live sport on TV, you see AR in action: the national flags and moving leader’s level superimposed on a swimming pool or the rev counter and gear-change imagery on the safety cage of a formula one car.
AR is more than entertainment like Pokémon Go, too. Apps like the Dulux Visualiser and the Ikea Place app put new colours and funky furniture in your room to help you avoid home decoration disaster.
The award-winning Gatwick Airport passenger app helps bleary-eyed travellers navigate the airport using their phones. Apps like ViewRanger Skyline add information and navigation to the great outdoors, annotating hiking trails in 23 countries without spoiling the wilderness.
Back in town, designers, architects and engineers take clients on guided tours of places that don’t yet exist.
According to IDC, the augmented and virtual reality market is expected to explode between now and 2022, to reach a market size of $209.2 billion.
1. Altogether now – the future impact of GIS 
Happy GIS Day!! Let’s celebrate the enormous – and growing – impact of GIS on everyday life.
More data, more processing power and greater demand. The economic impact that the geospatial industry has is already growing at a faster rate than the industry itself.
In the 2018 Geospatial Industry Outlook and Readiness Index, Geospatial Media and Communications found that, while the industry itself grew at a CAGR of 11.5% from 2013 to 2017, its economic impact grew at nearly double that rate, 20.9%. The research found a worldwide economic impact of $2,210.7 billion.
In the UK, the new Geospatial Commission has been tasked with unlocking an extra £11 billion of economic value each year by driving the better use of geospatial data.
That should be no surprise. As Colin Bray, the Chief Executive of Ordnance Survey Ireland says, “With the everyday use of information on our smartphones or tablets, there is a greater understanding of the value and use of spatial information With spatial information, we link all those data-sets whose only common point is location. This has been recognised by all government bodies and there is demand to use spatial data for more effective decision-making. No longer is OSi information just a back-drop map, it is actually a fundamental part of our users’ business solutions.”
Today, we celebrate the power of GIS and the geospatial data that feeds these systems.
Tomorrow, at the 1Spatial Smarter Data Smarter World Conference, we will dig deeper, discussing and exploring the latest innovations and solutions in our field. To learn more about the event, click here.