Breaking Tradition with PAI
The Many Faces of Positional Improvement
Positional Accuracy Improvement (PAI) can mean subtly different things depending on the audience. Fundamentally, positional improvement is moving data from one location to another, but the requirements and methodology can be split into three categories:
- Traditional Positional Improvement
- Generalised Positional Improvement
- Conflation
Traditional Positional Improvement is concerned primarily with re-aligning datasets, typically aligning customer asset data to new editions of base data, and so is often viewed as a one-off shifting activity. This is not strictly true, but the period between updates can be very long.
Generalised Positional Improvement represents the periodic re-capture of more accurate asset data. This information may be sourced from third-party suppliers, or during asset maintenance. This incremental improvement in positioning needs to be applied to the entire asset data set to improve positioning, becoming an ongoing set of activities.
Conflation is merging a new data source into a homogenous master data set, updating the master data to reflect the reality of the supplied data (handling updates, additions and deletes). This process also tends to be an ongoing activity, albeit with effort focussed on publication dates.
While all these concepts sit under the umbrella of Positional Improvement, they each require different techniques to be handled appropriately.
Fortunately, this is where 1Spatial’s PAI solution is targeted, with applications to suit each need.
In this article (the first in a series focusing on PAI techniques and our solution) we are going to explore Traditional Positional Improvement.
Breaking Down the Problem
At first glance, re-aligning data can seem a daunting task, but it can be broken into three main steps:
- Generate Shift Vectors
- Quality Control
- Apply Shift Vectors
Generate Shift Vectors
Sourcing Shift Vectors
The process of generating good quality shift vectors is vital to the whole process; poor shift vectors will result in poorly aligned assets.
- There are several options for sourcing shift vectors, each of varying cost and quality:
- Re-survey all assets (hugely expensive, highly accurate)
- Engage a third-party using data collection technologies such as: photogrammetry, LiDAR, to generate shifts (potentially expensive, potentially lower quality)
- Base data supplier, who may already have the shift vectors (potentially free, ultimately depends on whether they exist and are available between the vintages required) Generate them yourself from two vintages of base data (low cost, potentially highly accurate, under your control)
You can generate your own shifts through the 1Spatial PAI solution, or apply ones you have already created or sourced.
The 1Spatial PAI solution provides you with several pre-built, configurable, algorithms to apply to your data to generate shifts depending on what data you are working with, and ultimately what shifts you want to generate.
Types of Shifts
It is worth explaining a couple of the shift options available for use. Which one you select is guided by what your assets and requirements are.
For example, a utility company may have pipe assets that need to be re-positioned. They could make use of shift vectors generated from centroids of features, since moving pipes does not necessarily require millimetre accuracy.
However, should they decide that they do need a higher level of accuracy, centroids would be inappropriate, and a more thorough set of shift vectors should be generated.
There is a trade-off to be made; depending on the positioning of assets relative to the shifts, a thorough set of shifts may generate more distortion in a pipe asset than is wanted or required.
Generating Better Shift Vectors
To those not familiar with the data, this seems a simple problem to overcome. Simply match the buildings or linework and create shift vectors between them. However, this is only true if you have the luxury of common unique identifiers between vintages of base data mapping.
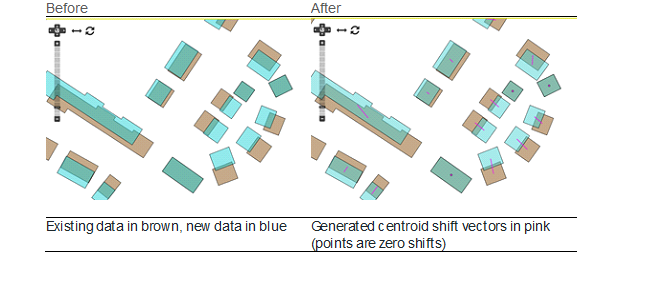
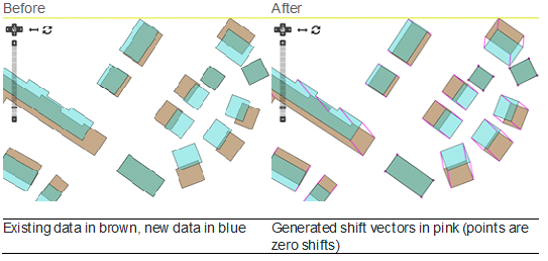
The 1Spatial PAI solution has pre-built algorithms to generate both centroid and vertex-to-vertex shifts, from data with common unique identifiers. In these cases, it is as simple as loading data, running the process and the shift vectors are created.
In many cases though, common, matching, unique identifiers are not available. Base data is supplied as sets of lines that may or may not have attribution. They may have unique identifiers, but they are unlikely to be maintained between base data vintages, so a different method is required.
The 1Spatial PAI solution provides an algorithm that will process an existing set of base data linework to populate a set of starting points, defined by no-code, configurable, business rules. The process is then repeated for the target base data set to generate end points.
Using the set of “start” and “end” points, we apply a process of matching where:
- All start and end points that lie on top of each other are converted to zero shifts for data that has not changed position between vintages.
- Next, match start and end points that are identified as junctions, generating shifts between them.
- For the remaining start points, examine all the remaining candidate end points and select the appropriate one (using our configurable algorithms), generating shifts between them.
The advantage of this approach is that while the algorithm has been designed to work well on most data sets, it is infinitely configurable to adapt to any specific data cases that may be presented.
Quality Control
What to Check
Regardless of whether you have sourced or generated the shift vectors, it makes good sense to evaluate them before committing to using them to shift your asset data.
The 1Spatial PAI solution provides four main shift vector checking algorithms:
- Direction
- Distance
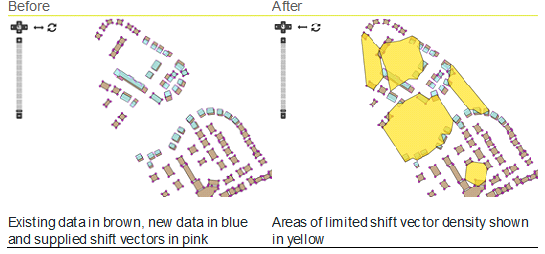
- Density
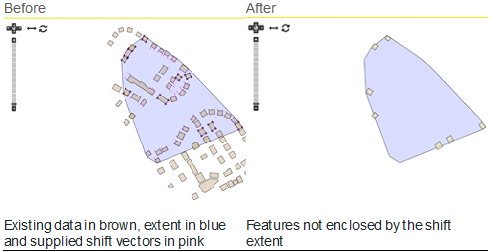
- Extent
When applying Traditional Positional Improvement, for a given area of data it would be expected that shifts are mostly in the same direction and the same distance. There are exceptions, for example shift vectors may move data in opposite directions either side of a major road or river.
All assets should be fully enclosed by the extent of the shift vector field; any that fall entirely or partially outside the extent are unlikely to be moved correctly. The shift vector field should also show a consistent density of shifts across the field. It is not typical to see large gaps in shift vector coverage in the middle of a city, compared to a more rural area.
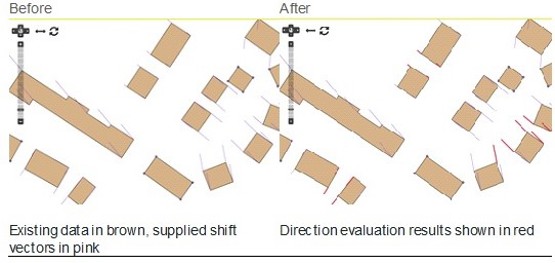
Direction
Direction is checked by taking a shift vector, examining the direction of all other shift vectors within a configurable area, and confirming that it is within a configurable tolerance of their average.
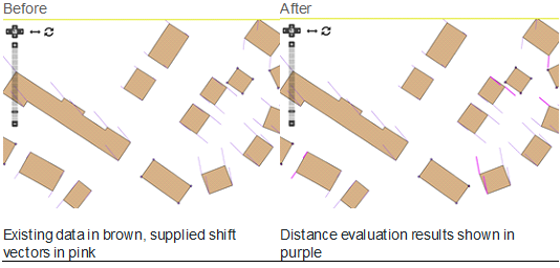
Distance
Distance is checked by taking a shift vector, examining the distance of all other shift vectors within a configurable area, and confirming that it is within a configurable tolerance of their average.
Density
Density is checked by evaluating the shift vector field and returning all triangulation lines or areas built from the shift vector field. These can then be combined to build visible areas to illustrate the density of shift vectors across the field (with configurable tolerances).
Extent
The extent is checked by building an area encompassing all shift vectors. Using this master triangulation area, any features that are only partially enclosed by the triangulation can be identified and visualised.
The 1Spatial PAI solution includes pre-built configurable algorithms that will automatically extend the shift vector field to include partially enclosed assets to ensure they would be moved correctly.
Apply Shift Vectors
Once the shift vectors are established and checked, the final step is to use them to move the asset data.
At this stage there are further considerations depending on the nature of the data:
- “Simple” asset data (for example, large features such as car parks, buildings, plots of land)
- “Complex” asset data (for example, manholes with relationships to underground pipe assets, or pylons and electricity cables)
The 1Spatial PAI solution uses a triangulation extent built from all the shift vectors supplied. Any target feature vertices within the triangulation are then moved using a linear interpolation of shift distance and direction based on the surrounding shift vector field.
This means that features close to zero shift vectors move only a small amount, whereas those features closer to a large shift vector will move a more significant amount.
This works very well for simple asset data containing features such as areas and polygons.
For more complex linework (e.g. case pipes, cables, or roads) and associated assets, (e.g. manholes or access points), just applying the shift vectors can lead to the associated assets becoming disjointed. To address this, we apply an intermediate step to the shift vector application.
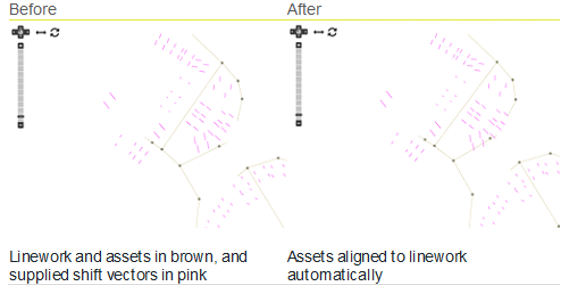
Constraining Geometries
By registering the linework as a “constraining geometry”, we can limit the effects of the shift vectors on any associated assets. While the linework is moved according to the shift vectors, we effectively build a special localised shift vector set just for the associated features. The result is that the linework is moved, and any associated assets are kept in their correct positions in relation to the linework.
How to Access the Solution
The 1Spatial PAI solution can either be accessed through 1Integrate as a separately purchased set of custom behaviours, or via a hosted 1DataGateway solution.
1DataGateway enables shift vector suppliers to upload their data and check and confirm the quality before it is accepted, and moves effort away from the data owner back to the supplier.
To find out more please get in touch.