

The Business Benefits of Esri’s ArcGIS Utility Network
The Business Benefits of Esri’s ArcGIS Utility Network
Walk past any excavation in the road and you get a small glimpse into the staggeringly complex overlapping networks of pipes and cables; telecoms, electricity, gas, water and wastewater which power and service our cities and towns.
It is one of the reasons why utilities have always been, for me at least, one of the most compelling use-cases for GIS across all industries. It has everything; features (assets) with precise locations that are difficult to obtain but vital to know; combined with the operational complexities of a network which is constantly evolving to meet societal demands, whilst requiring continuous repair and replacement.
Spatial relationships between assets
By the very nature of networks, understanding the relationships between these assets is fundamental.
- If a gas leak occurs on a section of pipe, how many customers are affected downstream?
- If a customer reports their drinking water has a petrol or diesel-like smell or taste, then is there an oil leak or fuel-spillage at some point upstream in the network?
And it’s not only the relationship of these assets to each other, we also need to understand these relationships in context to other real-world features.
- If a river bursts it’s banks and floods an electricity substation, which parts of the city will be affected?
- Are any of my customers on a kidney-dialysis machine and particularly vulnerable to an outage?
- Where do I need to deploy emergency generators or provide emergency heating, emergency bottled water?
These are all inherently spatial and location driven questions.
Combined with this is the need to serve this information and insight across the business; whether it’s providing up to date information for call centre staff to answer customer enquiries, through to making sure the network operatives themselves have the right information to do their jobs safely, often in tricky, remote working conditions.
Don’t let dirty data impact your network connectivity!
In this webinar, we talk about how Data quality issues can have unforeseen impacts on the migration of your source data to a Utility Network model. One small data error can have future implications, preventing you from successfully carrying out tasks such as running traces on your UN dataset.
Utilities providers face varied and frequent challenges
The challenges utilities face are becoming more varied, frequent, and disruptive. For example, the increased strains and impacts that severe climate events place on our networks, the drive towards net-zero, the increased role of homes and businesses not only as energy consumers but also as distributed energy resources (DER), or large scale infrastructure enhancements that will be required to the support electric vehicle (EV) rollout.
Utilities are well-established organisations and typically already have a legacy of IT systems and architecture; yet compared to digital innovators in other sectors they are often difficult to maintain and cumbersome.
Utilities digital mapping
Some utilities are recognising that in order to overcome the challenges and opportunities for utilities in the 21st century, they need to become digital businesses. They are realising the value of their digital data and the systems which maintain and exploit this data. At the heart of this, is the ‘GIS’ and the spatial data underpinning it.
Esri in the Utility
Esri has a long history in the provision of technology for the utilities industry. Back in 1987 Esri formed a partnership with the established engineering company Miner and Miner. Together they released the Esri ArcFM product which augmented the underlying Esri geometric network model with enhanced utility network functionality. Despite the subsequent acquisitions of Miner and Miner, by first Telvent and later Schneider Electricity, the use of ArcFM on top of the Esri platform remains a common configuration in utilities.

Utility Network Migration Solution
If you are interested in understanding more about ArcGIS Utility Network or how 1Spatial can help your organisation prepare and migrate to the Utility Network please get in touch.
Find Out About Migrating NowMature geometric network model
Yet the geometric network model is now almost 20 years old. The Esri technology platform has matured considerably over this time and evolved alongside wider enterprise computing paradigms. The legacy of the geometric model and its reliance on 3rd party tools was a hinderance to further maturing the role of GIS within the utility organisation and advancing ‘spatial’ within the enterprise.
ArcGIS Utility Network Migration
To this end, over the last 5 or 6 years Esri Inc has worked hard and invested heavily on addressing this deficiency. They have solved this problem with the ArcGIS Utility Network.
First outlined in the ‘Road Ahead for Network Management’ whitepaper in 2016, the Utility Network v1 was released in 2018 and continues to develop and evolve. Recent releases over the last 12-18 months have finally marked the production-readiness of Utility Network and seen the first commercial implementations go-live (largely to date in the US). Esri Inc has formally signalled the cessation of support for geometric network with the end-of-life of 10.6.1 in January 2024. Utilities will increasingly become compelled to move.
Whilst the Utility Network will undoubtedly empower the utility to meet the challenges they face for the next 15-20 years (the period of time Esri have committed to offer support for the Utility Network), migrating to it is not a small undertaking.
As well as a new data model, the Utility Network will introduce new processes, new tooling and even require existing integrations between the GIS and other business systems to be remapped and reimplemented. With this in mind, and with the clock now ticking, it’s perhaps a good time to remind ourselves in a bit more detail about the benefits of the Utility Network and what it brings to the utility business.
Better representation of the real-world network
The Utility Network allows for a far better representation of the real-world network and allows the GIS to align more closely with systems such as SCADA.
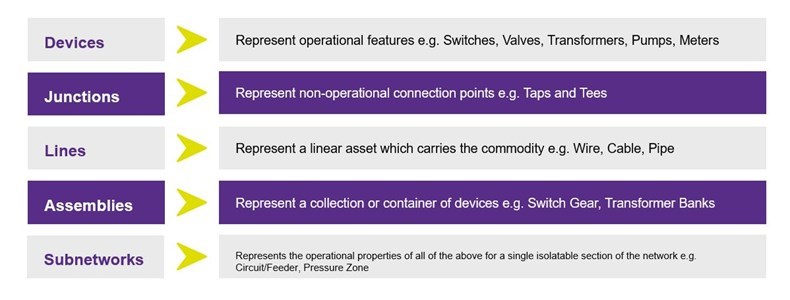
The underlying data model of the Utility Network is relatively compact; with all of our feature layers modelled into a small number of classes. The Utility Network for an organisation is actually modelled as two network types.
Domain networks
There will be one or more domain networks. A domain network models a single utility commodity, so for example, a water and wastewater utility will maintain 2 domain networks. Domain networks are all the assets, equipment, devices, pipes, and cables which are carrying our commodity or help control its flow.
Structure network
Each utility will also maintain a single structure network, which are all the associated equipment and structures which support the domain networks (e.g. poles, cabinets, pipe bridges, ducts, vaults, chambers etc.). The way the commodity flows through the network can also be defined, whether it’s a source or sink network and whether it’s radial or mesh in nature.
Watch Webinar: Next Generation Utility Network Management
Discover how ArcGIS Utility Network can leverage the power to build networks that suit your business requirements.
Watch the WebinarEsri Utility Network Model Systems
Modelling the network
However, despite the underlying data model being tightly-defined, it does allow for extensive configuration of the feature layers to model the network in a manner which best meets the needs of the organisation. Models can be defined to be relatively simple or very complex which, say in the electricity domain, support and model things like multiple phasing, individual fuse-ways on a transformer etc.
Foundation models
Esri has provided some assistance in this regard by publishing ‘foundation models’ for the different domains and these generally provide a good starting point from which an organisation can build upon. There are some examples of regional, consortium models being developed too, and some 3rd party vendors will define their own models which might include specific features and attributes which support their tooling and functionality, or with pre-built integration fields.
3D Support
By default, connectivity in the model can support 3D which instantly lends itself much better when modelling things like rising mains. Terminal configurations let us model the actual flow through a device and gone are the days when flow had to be determined by the direction a feature had been digitised in.
Feature layers of a domain network in a Utility Network model. Domain networks model all of the assets carrying a single utility commodity.
Abstracted representation of the network
Concepts such as assemblies and containment relationships then allow us to perform network abstraction and visualisation. For example, at certain scales or views we may just want to see substations or gas governors as point locations on the network; whilst when we zoom in or get closer we want to see and understand all of the complexity of the devices and equipment within.
Schematic representations
In addition, the Utility Network also facilitates the creation of schematic-representations based on the network connectivity. These schematic representations won’t perhaps create the large-scale geoschematics representation of zones that are used in many utilities, but for generating representations of one-line diagrams or substation diagrams it is well suited, or for visually representing connectivity resulting from traces on-the-fly.
Network tracing and analytics
And whilst we’re on the subject of network tracing this is a big area of benefit delivered by the Utility Network. The combination of a fixed, well-known underlying physical feature model, the necessity for clean and valid network data with high level of data integrity also allows for graph-based storage of the network. This means that network tracing and network analytics out of the back of Utility Network are fast, flexible and powerful.
Configurable traces can be defined which permit analytic functions during trace (e.g. count number of poles in the trace, sum of all the cable lengths etc). Trace stops can be based on category tags (e.g. protective devices, isolating devices) or on specific attribute values. You can also define specifically what do you want output from a trace e.g. only the isolation devices, only the poles etc.
Read more
1Spatial assisting Hunter Water for Utility Network Migration
Hunter Water’s GIS Lead, Sam De Lore, said, “Through our partnership with 1Spatial, we have seen a major improvement to our data quality, migration & validation processes. Prior to the implementation of the 1Spatial tools, we were limited to reactively fixing errors identified by the data migration after it was complete. Initially, this was yielding high error counts impacting testing & the development of critical integrations. We are now able to assess our source data before, during and after the migration process with the tools designed and configured by the 1Spatial team.”
Modern, services-based architecture
The Utility Network is a services-based architecture that helps future proof the utility. Gone are the days when editing the network would require direct database connections; instead all interactions within the network are exposed through a rich and expanding set of services.
Being services-based means that any of these services can be made available to any consuming platform whether its desktop, web or mobile; delivering a fully secure and more seamless experience across the enterprise.
It also means these same services can be called programmatically to perform network functions, and this allows a myriad of other business systems to be adorned with network-aware GIS capabilities in a controlled manner. This services-based approach also allows the large community of Esri partners to build and develop specific business applications on top of the core services. Expect to see a lot more of these in the coming years too.
The development of the Utility Network has not only brought this area in line with the principles already more developed in other areas of the Esri ecosystem, but in turn is also driving its wider development. For example, the new ‘branch versioning’ services in Esri were driven in a large part by the need for multi-user long-transaction support for Utility Network. Some of the core concepts developed for the Utility Network are also now emerging as more general network capabilities in other network use-cases in hydrology and transportation (the Trace Network).
Network and data integrity
At the very core of the Utility Network is a focus on data quality and data integrity of the network. As anyone who has ever had any dealings with 1Spatial will know, this is absolutely music to our ears as it’s the ethos we always have and will continue to endorse! It is the heart of our business.
Network rules, both connectivity-based and logical, are now enforced at the core level within Utility Network. This means that once data is in the Utility Network, it’s integrity will be maintained protecting the value of the data. If the model defines that ‘a specific 10” pipe type can only connect to 8” pipe in combination with a suitable reducer’ then you can be assured that only these asset configurations will be allowed.
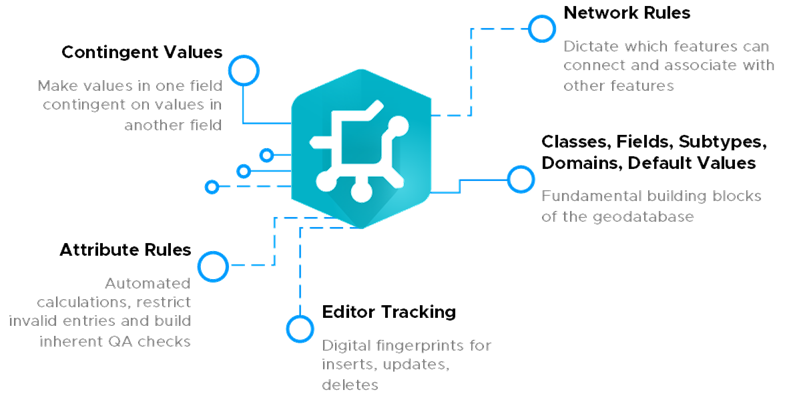
ArcGIS Utility Network has a number of built-in mechanisms to help enforce network data integrity and protect the value of your data.
Attribute rules define network assets and structures
Furthermore, attribute rules then allow an almost endless ability to define custom rules for assets and structures in our networks. For example, if an assets lifecycle attribute is set to ‘abandoned’ we may want it’s pressure attribute to be set to zero automatically. Attribute rules can be used to automatically populate attributes, restrict invalid edits during edit operations, and perform quality assurance checks on existing features.
Attribute rules are complementary to existing rules used in the geodatabase, such as domains and subtypes. Attribute rules offer powerful and flexible functionality and I fully expect to see some interesting and impressive examples being demonstrated in the near future. Once again through the services-based architecture once our attribute rules are defined, the same rules can be read and enforced on all of our editing platforms and applications.
Propagation rules
Propagation rules allow us to decide what effect deleting a feature may have; for example, if we try to delete a substation container do we want that to automatically cascade the deletion of all the substation internal devices? Or do we want deletion to be restricted until all devices inside the substation are first deleted?
The concepts of ‘Group’ templates and assemblies provide us with the ability to place multiple assets with a single-click, whilst ensuring all necessary connectivity and associations are also installed.
Data validation
Embedding this level of data validation into our network data makes total sense and really does enhance and protect the data asset. Naturally it does pose the problem that in order to get our data into a valid Utility Network it does need to already conform to the level of network integrity we set. This is where organisations have to spend time considering the configuration of the Utility Network model they are going to target and the additional overheads of data preparation, cleanse and fix-up that will entail to get the data in to the model and truly unlock the power and benefits of the Utility Network.
I hope you found this overview of the business benefits of the Utility Network useful. Stay tuned for future content where we’ll discuss in more detail the top things to consider when moving to the new UN Model, the steps organisations can go through to prepare their data for the move to the Utility Network, the appropriate configuration and modelling of the Utility Network, and how to ensure an effective smooth transition and migration to adopting the Utility Network.